.
S O U R C E : Aging Cell
Abstract
Markers of biological aging have potential utility in primary care and public health. We developed a model of age based on untargeted metabolic profiling across multiple platforms, including nuclear magnetic resonance spectroscopy and liquid chromatography–mass spectrometry in urine and serum, within a large sample (N = 2,239) from the UK Airwave cohort. We validated a subset of model predictors in a Finnish cohort including repeat measurements from 2,144 individuals. We investigated the determinants of accelerated aging, including lifestyle and psychological risk factors for premature mortality. The metabolomic age model was well correlated with chronological age (mean r = .86 across independent test sets). Increased metabolomic age acceleration (mAA) was associated after false discovery rate (FDR) correction with overweight/obesity, diabetes, heavy alcohol use and depression. DNA methylation age acceleration measures were uncorrelated with mAA. Increased DNA methylation phenotypic age acceleration (N = 1,110) was associated after FDR correction with heavy alcohol use, hypertension and low income. In conclusion, metabolomics is a promising approach for the assessment of biological age and appears complementary to established epigenetic clocks.
1 INTRODUCTION
Aging has been defined as the “time‐dependent decline of functional capacity and stress resistance, associated with increased risk of morbidity and mortality” (Burkle et al., 2015). Environmental stressors, including lifestyle and social adversity (Stringhini et al., 2018), psychological disorders (Chiu et al., 2018; Wolf & Morrison, 2017), and genetic factors (McDaid et al., 2017) may influence the aging process, leading to differing aging rates. Traditionally, quantitative assessment of “the rate of aging” relies on the analysis of mortality curves of populations. However, at the level of a single individual, this method does not allow assessment of the state of aging (i.e., the state of the functional decline) and a prediction of the risk of morbidity and remaining life expectancy. In contrast, markers of “biological age” that can be assessed at any point in the lifespan may allow, for instance, early identification of individuals or groups at risk of developing age‐related disease or frailty and enable targeted interventions (Ferrucci, Levine, Kuo, & Simonsick, 2018).
Since aging is a process that affects almost all tissues and organs and involves crosstalk between multiple physiological systems, there has been increased research into composite markers of aging, involving multiple parameters (Jylhävä, Pedersen, & Hägg, 2017). Biological age scores have been developed by combining established clinical biomarkers (Levine, 2013) (Belsky et al., 2015) and have been associated with measures of functional decline such as cognitive ability (Belsky et al., 2015). Modern “omics” platforms have provided new opportunities for the systematic and agnostic assessment of biological aging. Analysis of genome‐wide DNA methylation (Hannum et al., 2013; Horvath, 2013; Levine et al., 2018), mRNA (Peters et al., 2015) and miRNAs (Huan et al., 2018) has allowed the development of multi‐parameter “omic clocks,” built upon molecular changes that tick at an average rate consistent with chronological age. DNA methylation age acceleration, defined as having a greater DNA methylation age than chronological age (i.e., a faster than average “ticking rate”), is associated with multiple noncommunicable disease (NCD) risk factors (Fiorito et al., 2019) and predictive of aging outcomes such as frailty, cognitive decline (Horvath et al., 2016) and all‐cause mortality (Chen et al., 2016; Dugue et al., 2018).
Metabolomics, the profiling of small molecules, is a promising technology for the comprehensive assessment of biological aging. As the final product of cellular metabolism, metabolites may provide a more complete picture of biological processes and a stronger phenotypic representation than other “omic profiles.” Although metabolomic studies have reported strong associations between metabolites and age, these have been of limited sample size (Chaleckis, Murakami, Takada, Kondoh, & Yanagida, 2016; Rist et al., 2017) or employed targeted analyses with only partial coverage of the full metabolome (Auro et al., 2014) (Hertel et al., 2016; Yu et al., 2012). Larger sample sizes can provide more precise, and potentially less biased, assessments of a typical biological age in a given population, while the use of multiple analytical platforms can provide a more complete assessment of metabolic processes relevant to biological aging. Only one study provided an overall assessment of biological aging, based on urinary proton nuclear magnetic resonance spectroscopy (NMR), reporting that metabolomic age was associated with time to death, after adjustment for chronological age and other risk factors (Hertel et al., 2016).
In the present study, we aimed to develop a systematic assessment of biological age using untargeted metabolomics. We have employed multiple metabolomic analytical platforms, providing unprecedented metabolome coverage, to develop a predictive model of age, within a large sample from the Airwave cohort of employees of the police service in Great Britain. A second cohort was used for longitudinal validation of selected metabolic age predictors. To assess whether deviations between the predicted metabolomic age and chronological age reflect differences in biological aging rate, we have investigated associations with risk factors of premature mortality, including the WHO “25 × 25” risk factors (World Health Organisation, 2013) (hypertension, diabetes, obesity, smoking, alcohol use and physical inactivity) and socio‐economic and psychological risk factors (income, depression, anxiety, post‐traumatic stress disorder (PTSD)). Finally, to assess whether metabolomic age is complementary to established epigenetic assessments of age, we have assessed the relationship between metabolomic and epigenetic aging, and their relative associations with risk factors.
2 RESULTS
2.1 Study population
The study population comprised 2,238 participants of the Airwave cohort with full metabolomic data. A 60.5% of participants were male, and mean age was 41.24 years (SD: 9.1, range: 19.2–65.2 years). Most participants (97.5%) were of white British ethnicity, and 27.8% of participants were educated to degree level. The demographic characteristics of this sample are representative of the wider cohort (Elliott et al., 2014).
2.2 Metabolomic age modelling
Metabolomic data were acquired from both urine and serum samples using multiple proton nuclear magnetic resonance spectroscopy (NMR) and ultra‐performance liquid chromatography–mass spectrometry (UPLC‐MS) platforms, providing in total nine different metabolomic data types (Table 1).
TABLE 1. Summary of metabolomic platforms used in analysis, including predictive performance in single platform analysis (Unable to reproduce Table 1 here. Please visit the source)
2.2.1 Age prediction by platform
We first assessed the age prediction of each metabolomic platform separately (Table 1). We followed a bootstrapping procedure and trained elastic net models of age in re‐sampled training portions (80%) of our data 100 times, for each metabolomic platform. Predictive performance was then assessed in the independent training sets (remaining 20% of data) to provide unbiased estimates. The best performing platforms were reversed‐phase UPLC‐MS in positive mode in urine (“uRPOS”) and lipid‐targeted reversed‐phase UPLC‐MS in positive mode in serum (“sLPOS”) that had mean correlations between predicted and chronological age of 0.83 (bootstrap 95% confidence interval (CI): 0.80, 0.85) and 0.80 (95% CI 0.77, 0.82), respectively, across testing sets. The worst performing platforms were NMR in urine (NOESY experiment, “uNMR”) and Bruker IVDr Lipoprotein Subclass Analysis derived from NMR in serum (“sBiLISA”) with mean correlations between predicted and chronological age of 0.58 (CI: 0.52, 0.62) and 0.45 (95% CI 0.39,0.51), respectively, across testing sets.
2.2.2 Multi‐platform metabolomic age
To find the combination of metabolomic data sets that provided the best age prediction performance, we combined the metabolomic data sets and constructed further elastic net models of age, sequentially leaving one platform out each time. Predictive performance of age (minimization of mean squared error (MSE) in 10‐fold cross‐validation was improved by use of only the four following platforms (Figure S1): sBiLISA, sLPOS, uRPOS and hydrophilic interaction UPLC‐MS in positive mode in urine (“uHPOS”).
These four platforms were retained to give a total of 28,941 metabolic features (retention time‐mz pairs or lipoprotein measurements) for the final stage of model building. To define a stable metabolomic age score for each participant, we again followed the bootstrapping procedure of re‐sampling training and testing portions of this data set 100 times. Prediction of age in the independent training sets was highly accurate and stable across all re‐samplings with mean correlation between predicted and chronological age of 0.86 (95% CI: 0.85, 0.88) (Figure 1a). Mean absolute error (MAE) across training sets was on average 3.71 years, with a bootstrap 95% CI of 3.37 to 3.96 years. The metabolomic age of each participant was assigned as their mean predicted age across the 100 bootstrapped models (Figure 1b). Metabolomic age acceleration (mAA) was then defined as the difference, at a given age, between chronological and metabolomic age (Figure 1c).
FIGURE 1.
Summary of metabolomic age prediction. (a) Distribution of Pearson's correlation coefficient ® between chronological and predicted age across bootstrapped test sets. (b) Metabolomic age plotted against chronological age. © Distribution of metabolomic age acceleration scores.
Age prediction was also stable across different population areas (Table S1, Figure 2). Correlation between predicted and chronological age across different police services of Great Britain (using remaining study areas as training sets to predict age in each respective study area) ranged from 0.82 in Scotland to 0.87 in the North West of England.
FIGURE 2.
Metabolomic age plotted against chronological age across different independent study areas. Seven models in this analysis were trained separately on data from participants in six out of the seven study areas and validated with data in the remaining study area shown.
2.3 Metabolomic age predictors
The median number of metabolic features selected into each model in the final stage was 1,311 (range: 498–9,754) (see Data Set S1 for list of predictors along with Data Set S2 annotation information). 62 metabolic features were present in 100% of models, 450 metabolic features were present in at least 75%, 1,080 metabolic features were present in at least 50%, and 2,990 were present in only one model. Features present in at least 75% included 8 lipoprotein subclasses from sBiLISA and 207, 81 and 154 features (retention time‐m/z pairs) from the sLPOS, uHPOS and uRPOS platforms, respectively.
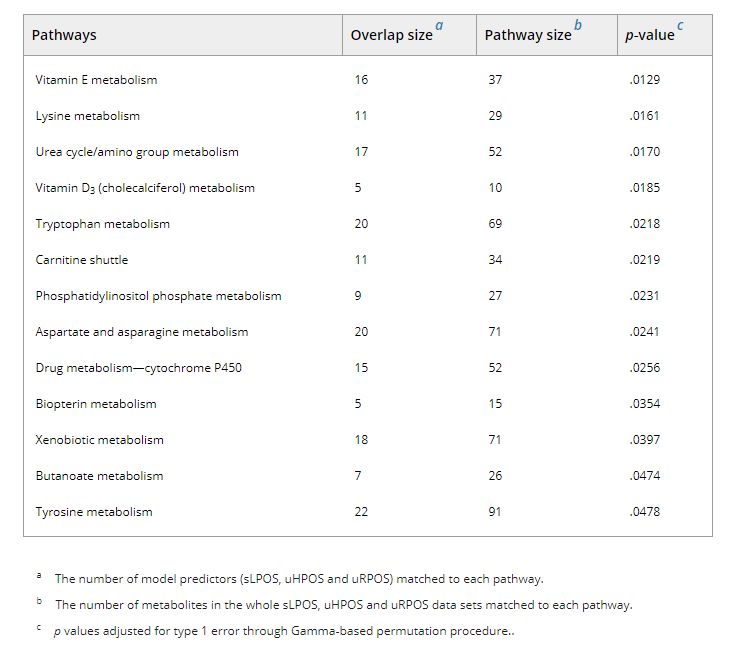
Pathway enrichment analysis, using the Mummichog algorithm performed across the UPLC‐MS‐derived features that were present in at least 75% of models identified enrichment in thirteen metabolic pathways (Table 2, Figure 3): vitamin E metabolism; lysine metabolism; urea cycle/amino group metabolism; vitamin D3 (cholecalciferol) metabolism; tryptophan metabolism; carnitine shuttle; phosphatidylinositol phosphate metabolism; aspartate and asparagine metabolism; drug metabolism—cytochrome P450; biopterin metabolism; xenobiotic metabolism; butanoate metabolism; and tyrosine metabolism.
TABLE 2.
a The number of model predictors (sLPOS, uHPOS and uRPOS) matched to each pathway.
b The number of metabolites in the whole sLPOS, uHPOS and uRPOS data sets matched to each pathway.
c p values adjusted for type 1 error through Gamma‐based permutation procedure..

FIGURE 3.
Metabolic network visualisation of significantly enriched pathways based on the manually curated KEGG global metabolic network (Chong et al., 2018). The metabolites of significantly enriched pathways are represented as nodes on the network. Empty nodes represent compounds identified from the feature list by Mummichog but not significant, while solid nodes represent significantly enriched features. Note not all metabolites from the KEGG global network are displayed.
We examined concentration changes of eleven metabolites included in over 50% of age prediction models, that were available in an independent cohort, the Northern Finnish Birth Cohort 1966, that had serum NMR metabolomic data measured at two ages, 31 and 46 years, among 2,144 individuals. Nine of these metabolites (82%) changed significantly with age (validation p < .005), in the same direction as predicted in the metabolomic age model (Table S2).
2.4 Comparison with DNA methylation age
DNA methylation age was assessed for 1,110 participants, using the multi‐tissue clock derived by Horvath (Horvath, 2013) and the blood‐derived clock of Hannum et al. (2013) both trained on chronological age, and the clock of Levine et al. (2018) that was trained on “phenotypic age.” Demographic characteristics for this sample were similar to those for participants with metabolomic age available (age range = 19.9–65.2 years, 60% male). DNA methylation age measures were strongly correlated with chronological age (Table 3) and metabolomic age (for 837 participants with both metabolomic and epigenetic data, Table 3). Mean age acceleration scores were 0.00 (standard deviation (SD): 3.65), 0.00 (SD: 3.19) and 0.01 (SD: 5.12) years for Horvath, Hannum and Phenotypic ages, respectively, while mean mAA was 0.00 years (SD: 2.13 years). No correlation was observed between epigenetic age acceleration measures and mAA (Table 3).
.../...
.
Edited by Engadin, 11 May 2020 - 08:28 PM.