


https://www.youtube....h?v=DDmxgjP0ft8
Attached Files
-
 1.png 453.99KB
0 downloads
1.png 453.99KB
0 downloads

Posted 31 January 2024 - 08:34 PM
https://www.youtube....tOQ-uIkORw&t=1s
1.png 406.78KB
0 downloads


Posted 05 March 2024 - 10:53 AM
Hi Michael, as you monitor so accurately, could I ask you what in average is the difference between your Phenotypic Age (Levine) and your CA? Over which period of time?
You must have that number, averaging over all years since you report to us. I do not recollect you gave this (apologize if I am overlooking ...).
If you have enough points you might also detect a trend in that differential.

Posted 10 March 2024 - 12:25 PM
Thank you for sharing Michael.
For what it matters and be of significance, my data show -13.2 years in average, 2.1 years STD, over 18 years (50-68), n=20, flat (no trend downward or upward)
Feel free to comment!
Edited by albedo, 10 March 2024 - 12:40 PM.
Posted 17 March 2024 - 11:12 AM
phenothumb.png 551.58KB
0 downloads
Edited by Michael Lustgarten, 17 March 2024 - 11:12 AM.
Posted 18 March 2024 - 12:54 PM
19.5y Younger Biological Age: My Best Data Yet (31 Tests Since 2018)
https://www.youtube....h?v=mUEGbBEPzgo
Thank you Michael. Looking at your data and even considering error bars my bet is you are seeing a real downward effect on your BA using Phenotypic Age. Don't you?
Wishing you all the best can keep your -19.5 years difference!
Edited by albedo, 18 March 2024 - 12:56 PM.
Posted 27 March 2024 - 07:33 AM
It would be great if you confirm your downward trend, Michael. As mentioned, I am flat for the the time being but at least not doing worse. Please have the trend in mind in your considerations and the statistics of your data to extract the signal. It would be very interesting and a great topic for a next video.
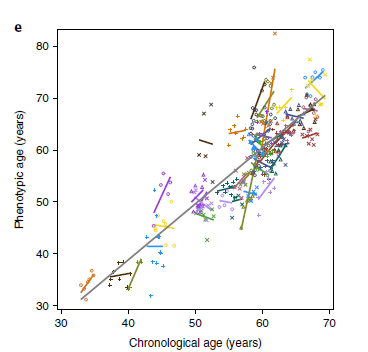
Here is a cohort of people, followed longitudinally, showing different trends using Levine's Phenotypic Age we both use:
Phenotypic Age - Snyder.png 33KB
1 downloads
Ahadi S, Zhou W, Schüssler-Fiorenza Rose SM, et al. Personal aging markers and ageotypes revealed by deep longitudinal profiling. Nat Med. 2020;26(1):83-90.
https://www.nature.c...1591-019-0719-5
Posted 27 March 2024 - 07:49 AM
Thank you Michael. Looking at your data and even considering error bars my bet is you are seeing a real downward effect on your BA using Phenotypic Age. Don't you?
Wishing you all the best can keep your -19.5 years difference!
It would be great if you confirm your downward trend, Michael. As mentioned, I am flat for the the time being but at least not doing worse. Please have the trend in mind in your considerations and the statistics of your data to extract the signal. It would be very interesting and a great topic for a next video.
Here is a cohort of people, followed longitudinally, showing different trends using Levine's Phenotypic Age we both use:
Ahadi S, Zhou W, Schüssler-Fiorenza Rose SM, et al. Personal aging markers and ageotypes revealed by deep longitudinal profiling. Nat Med. 2020;26(1):83-90.
https://www.nature.c...1591-019-0719-5
Posted 27 March 2024 - 07:38 PM
It would be great if you confirm your downward trend, Michael. As mentioned, I am flat for the the time being but at least not doing worse. Please have the trend in mind in your considerations and the statistics of your data to extract the signal. It would be very interesting and a great topic for a next video.
Here is a cohort of people, followed longitudinally, showing different trends using Levine's Phenotypic Age we both use:
Ahadi S, Zhou W, Schüssler-Fiorenza Rose SM, et al. Personal aging markers and ageotypes revealed by deep longitudinal profiling. Nat Med. 2020;26(1):83-90.
https://www.nature.c...1591-019-0719-5
I will albedo, I promise, but I can't promise when...
It would be great if you confirm your downward trend, Michael. As mentioned, I am flat for the the time being but at least not doing worse. Please have the trend in mind in your considerations and the statistics of your data to extract the signal. It would be very interesting and a great topic for a next video.
Here is a cohort of people, followed longitudinally, showing different trends using Levine's Phenotypic Age we both use:
Ahadi S, Zhou W, Schüssler-Fiorenza Rose SM, et al. Personal aging markers and ageotypes revealed by deep longitudinal profiling. Nat Med. 2020;26(1):83-90.
https://www.nature.c...1591-019-0719-5
Also, while I was familiar with the paper, I hadn't seen this image, thanks for that!
Edited by Michael Lustgarten, 27 March 2024 - 07:40 PM.

Posted 27 March 2024 - 08:34 PM
I will albedo, I promise, but I can't promise when...
Also, while I was familiar with the paper, I hadn't seen this image, thanks for that!
Agree Michael. I attended one a Snyder's presentation and he was kind of presenting that slide as a validation point so maybe it is understandable it often goes overlooked at first sight.
They indeed write:
"...Finally, as an independent examination of age, we used the published
phenotypic age formula to assess whether a reported aging
metric changes with time at a personal level27,28. Although overall
phenotypic age increased with age as expected (slope = 1.07), consistent
with the results presented above, the individual phenotypic
age slopes differed among the different participants, with 15 participants
even showing negative values (Fig. 3e). These results using
an independent metric further suggest that individuals are aging
at different rates as well as potentially through different biological
mechanisms.
These results indicate that individuals can have distinct aging patterns,
or ageotypes. To systematically analyze the individual aging
patterns, we further analyzed the 608 molecules that significantly
correlated with age in at least six individuals (see Supplementary..."
Posted 29 April 2024 - 10:51 AM
@Michael. Have you ever come across a difference between the aging.ai results (v3.0, we both know v1.0 is no longer supported) and the BA value you get when using Senoclock by Deep Longevity? Both v3.0 and Senoclock use 30 blood biomarkers. The site aging.ai seems dead though. I never used Senoclock but it should provide similar results I guess. Thank you.
Edited by albedo, 29 April 2024 - 11:11 AM.
Posted 29 April 2024 - 05:53 PM
@Michael. Have you ever come across a difference between the aging.ai results (v3.0, we both know v1.0 is no longer supported) and the BA value you get when using Senoclock by Deep Longevity? Both v3.0 and Senoclock use 30 blood biomarkers. The site aging.ai seems dead though. I never used Senoclock but it should provide similar results I guess. Thank you.
Hi albedo, I have. I contacted DL after aging.ai was discontinued, and they offered for me to use it. I entered my data, but it didn't match aging.ai, so the algorithm is different...
Posted 07 June 2024 - 10:32 AM
https://www.longecit...ndpost&p=931310
Comparing clocks. PhenoAgeV2 seem leading with others too ....
"...The most rigorous of the four, AA2 task demonstrates that second-generation aging clocks (PhenoAgeV2
[98], GrimAgeV1 [17], GrimAgeV2 [99], and PhenoAgeV1 [16]) appear on top, particularly
at predicting aging acceleration for the ISD class (Fig. 3E, Supplementary Materials Fig.
A5). Nevertheless, all clocks failed to detect aging acceleration in patients with cardiovascular and
metabolic diseases, at least at the statistically significant level (see Figs. A3 and A4 for results
without FDR correction)..." (red mine)
bioRxiv 2024.06.06.597715; doi: https://doi.org/10.1...24.06.06.597715
https://www.biorxiv.....06.06.597715v1
"The success of clinical trials of longevity drugs relies heavily on identifying integrative health and aging biomarkers, such as biological age. Epigenetic aging clocks predict the biological age of an individual using their DNA methylation profiles, commonly retrieved from blood samples. However, there is no standardized methodology to validate and compare epigenetic clock models as yet. We propose ComputAgeBench, a unifying framework that comprises such a methodology and a dataset for comprehensive benchmarking of different clinically relevant aging clocks. Our methodology exploits the core idea that reliable aging clocks must be able to distinguish between healthy individuals and those with aging-accelerating conditions. Specifically, we collected and harmonized 66 public datasets of blood DNA methylation, covering 19 such conditions across different ages and tested 13 published clock models. We believe our work will bring the fields of aging biology and machine learning closer together for the research on reliable biomarkers of health and aging."


0 members, 1 guests, 0 anonymous users


Community Forum Software by IP.Board
Licensed to: ImmInst.org

