
.
F U L L T E X T S O U R C E : nature
Abstract
A causal factor in mammalian aging is the accumulation of senescent cells (SnCs). SnCs cause chronic inflammation, and removing SnCs decelerates aging in mice. Despite their importance, turnover rates of SnCs are unknown, and their connection to aging dynamics is unclear. Here we use longitudinal SnC measurements and induction experiments to show that SnCs turn over rapidly in young mice, with a half-life of days, but slow their own removal rate to a half-life of weeks in old mice. This leads to a critical-slowing-down that generates persistent SnC fluctuations. We further demonstrate that a mathematical model, in which death occurs when fluctuating SnCs cross a threshold, quantitatively recapitulates the Gompertz law of mortality in mice and humans. The model can go beyond SnCs to explain the effects of lifespan-modulating interventions in Drosophila and C. elegans, including scaling of survival-curves and rapid effects of dietary shifts on mortality.
Introduction
Senescent cells (SnCs) accumulate with age in mice and humans in many tissues1,2,3,4,5,6,7, due in part to DNA damage, damaged telomeres, and oxidative stress5,8. These cells, characterized by high levels of p16 and SA-β-Gal5, enter permanent cell cycle arrest, and secrete a characteristic profile of molecules including pro-inflammatory signals9 and factors that slow regeneration9 (Fig. 1a). They have physiological roles in development, cancer prevention, and wound healing9,10,11. However, as organisms age, accumulating levels of SnC cause chronic inflammation and increase the risk of many age-related diseases, including osteoarthritis, neurodegeneration, and atherosclerosis12,13,14,15,16,17,18,19,20,21,22,23,24.
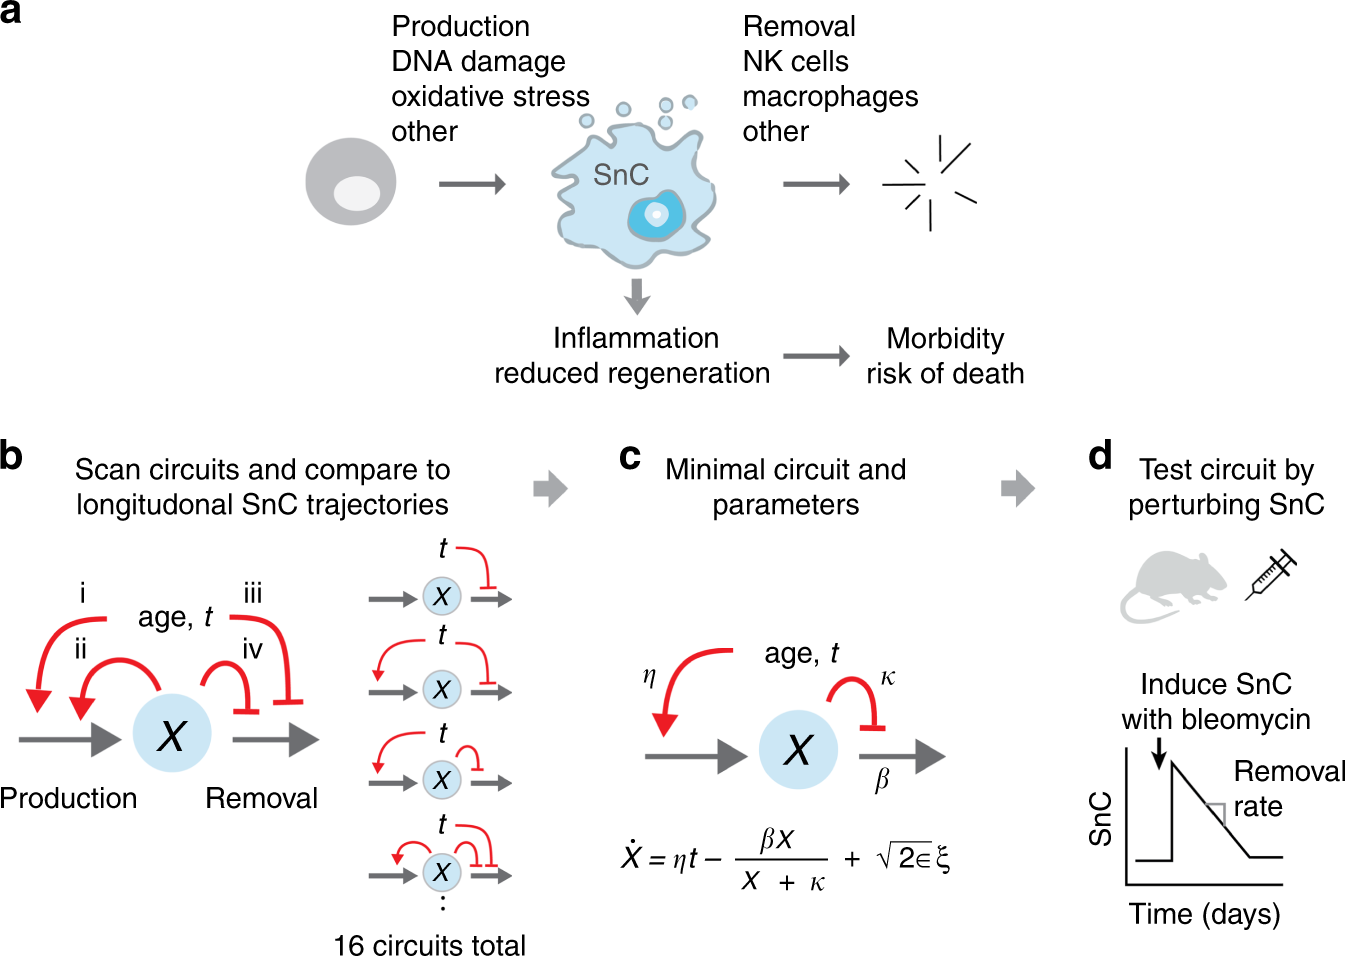
Fig. 1
Approach for inferring SnC dynamics throughout adulthood. a Many processes, including DNA damage and developmental and paracrine signals, lead to SnC production. SnCs are cleared by immune mechanisms, and secrete factors that lead to morbidity and mortality. b–d We scanned a wide class of models for SnC dynamics, and compared them to longitudinal SnC data and direct SnC perturbation experiments to establish a minimal model for SnC stochastic dynamics and determine its rate constants. In the minimal model, η is the increase in SnC production rate with age, β is the removal rate, κ is the half-way saturation point for removal, and ϵ is the noise amplitude.
Accumulation of SnCs is known to be causal for aging in mice: continuous targeted elimination of whole-body SnCs increases mean lifespan by 25%, attenuates age-related deterioration of heart, kidney, and fat, delays cancer development25 and causes improvement in the above-mentioned diseases.
These studies indicate that SnC abundance is an important causal variable in the aging process. Despite their importance, however, the production and removal rates of SnCs are unknown9,26. For example, it is unclear whether SnCs passively accumulate or if they are turned over rapidly, and if so, whether their half-life changes with age. Since turnover affects the ability of a system to respond to fluctuations, information about these rates is crucial in order to mathematically test ideas about the possible role of SnCs in the age-dependent variations in morbidity and mortality between individuals.
Here, we address this experimentally and theoretically. To understand the dynamics of SnCs, we scanned a wide class of mathematical models of SnC dynamics, and compared these models to longitudinal SnC trajectories1 and direct SnC induction experiments in mice (Fig. 1b–d). The models all describe SnC production and removal. They differ from one another in the way that production and removal rates are affected by age and by SnC abundance. The models describe all combinations of four possible mechanisms for accumulation of SnCs (Fig 1b): (i) SnC production rate increases with age due to accumulation of mutations27, telomere damage, and other factors that trigger cellular senescence11, (ii) SnCs catalyze their own production by paracrine and bystander effects28, (iii) SnC removal decreases with age due to age-related decline in immune surveillance functions29, and (iv) SnCs reduce their own removal rate, which can be due to SnC-related signaling, such as SASP, downregulation of immune surveillance by SnCs, SnCs saturating immune surveillance mechanisms (similar to saturation of an enzyme by its substrate), or to disruption of tissue and extracellular matrix architecture that interferes with removal.
Mechanism (iv) is distinct from mechanism (iii) because the decline in removal rate in (iv) depends on SnC abundance, rather than on age directly. Although (iv) can arise from various biological processes, we denote it for simplicity ‘saturation of removal’. These four effects lead to 16 different circuits (Fig. 1b) with all combinations of whether or not each of effects (i–iv) occur. Additionally, each of the 16 models includes parameters for basal production and removal. The models have rate constants that are currently uncharacterized. We also tested models which incorporate additional non-linearities (Supplementary Note 1, Supplementary Fig. 1).
Results
SnC dynamics during ageing in mice
To find which of the model mechanisms best describes SnC dynamics, and with which rate constants, we compared the models to longitudinal data on SnC abundance in mice collected by Burd et al. 1. SnC abundance was measured using a luciferase reporter for the expression of p16INK4a, a biomarker for SnCs. Total body luminescence (TBL) was monitored every 8 weeks for 33 mice, from early age (8 weeks) to middle–late adulthood (80 weeks) (Fig. 2a).
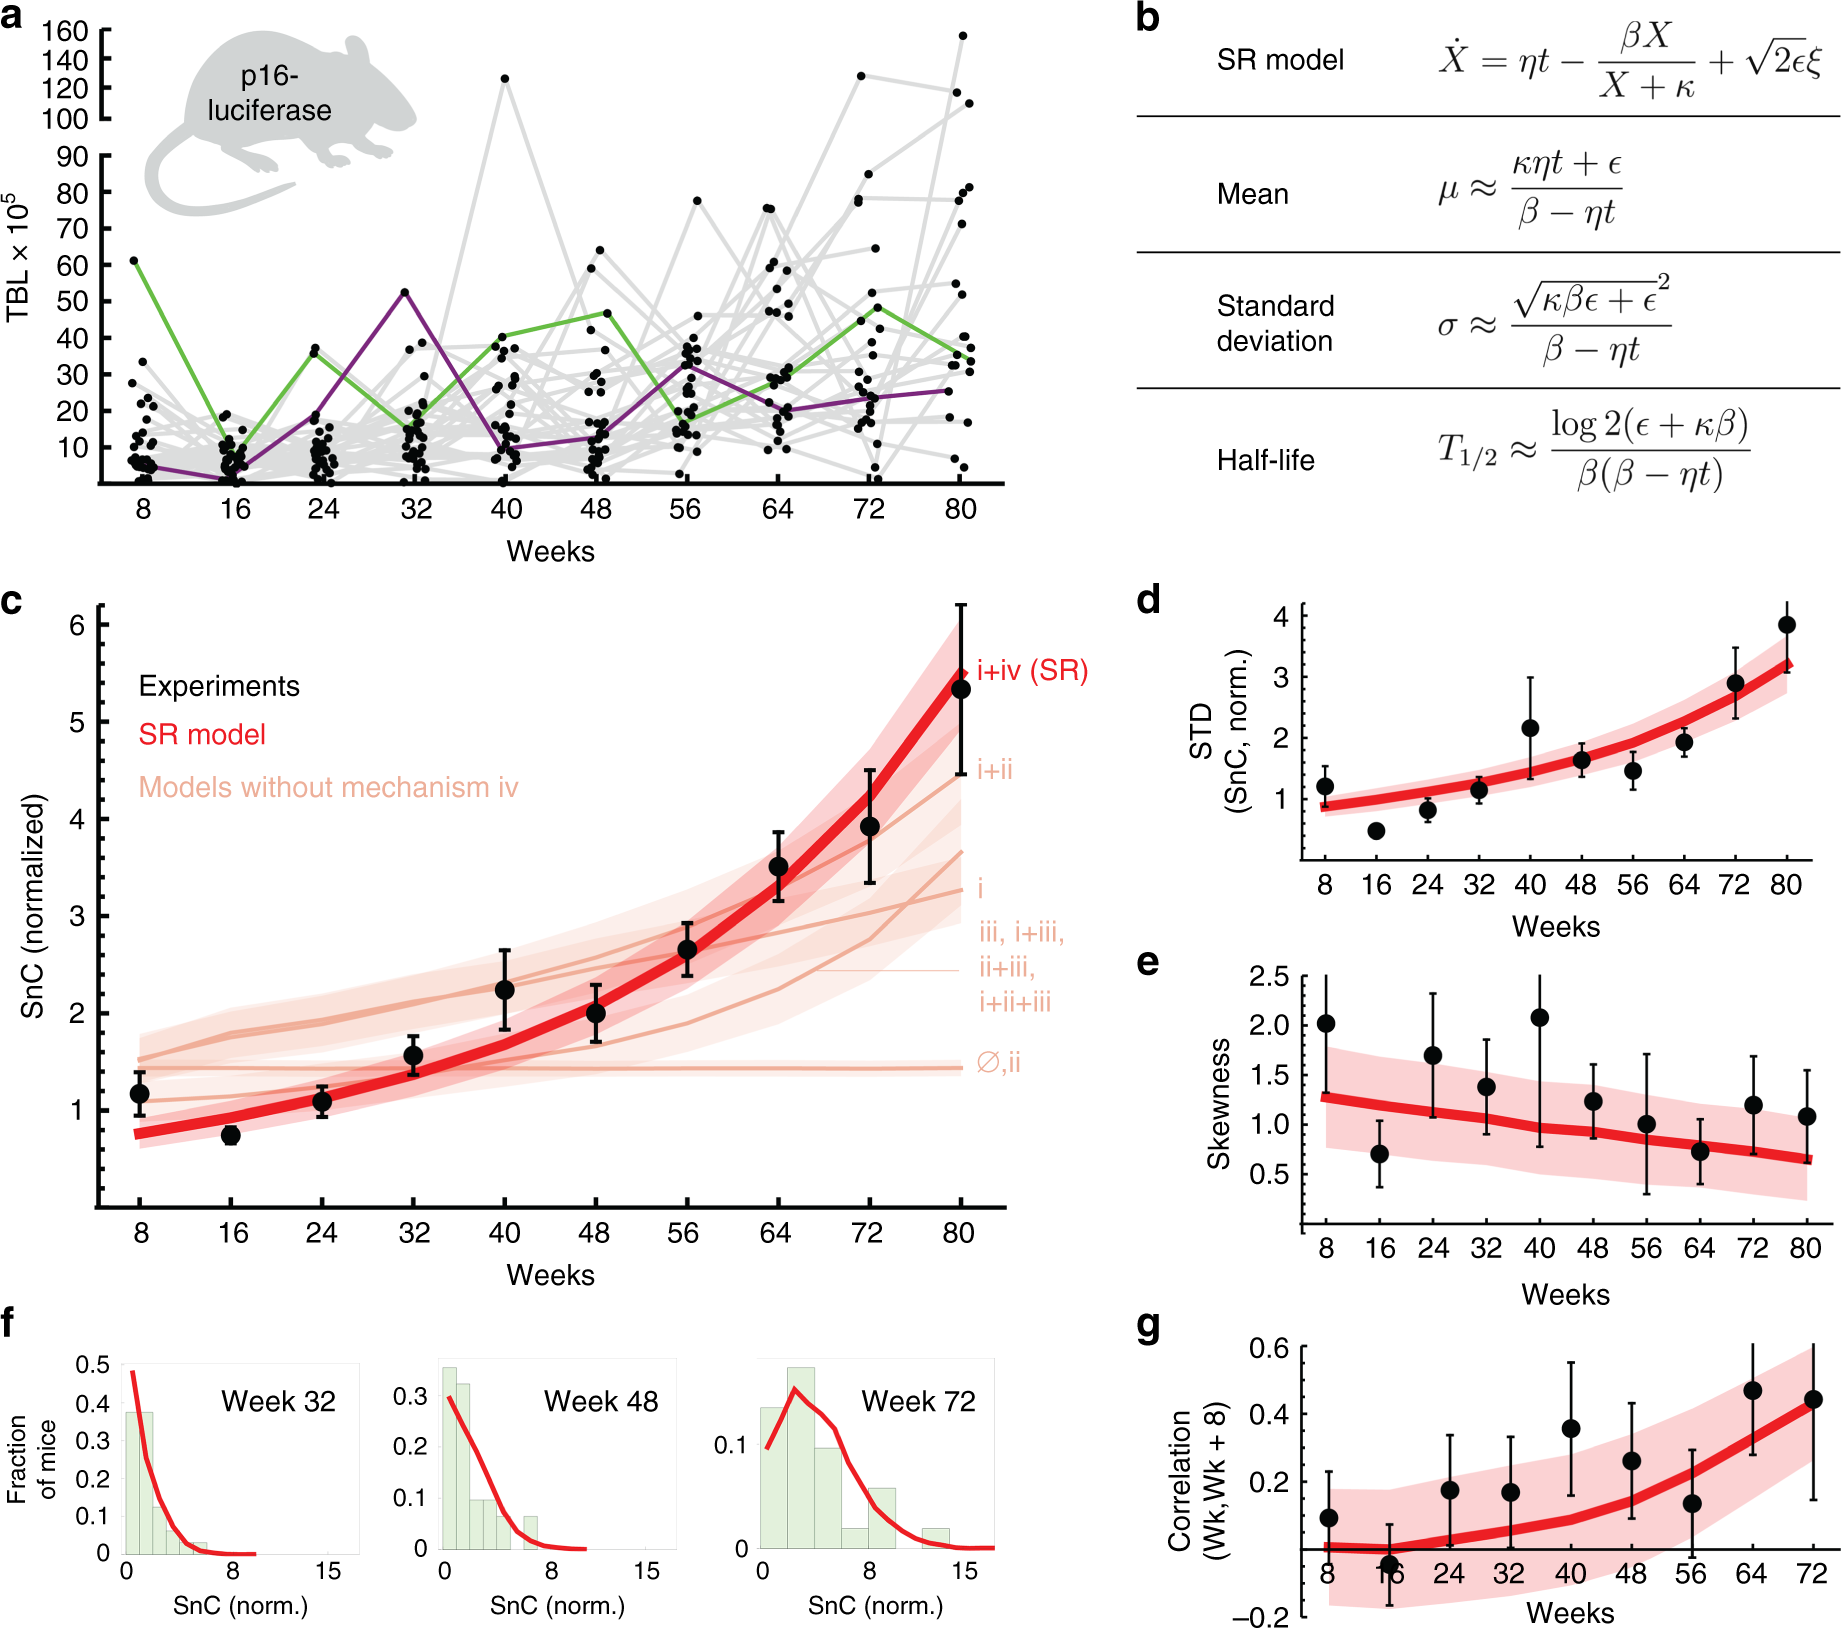
Fig. 2
Saturated-removal (SR) model captures longitudinal SnC trajectories in mice. a Total body luminescence (TBL) of p16-luciferase in mice (n = 33). Gray lines connect data from the same individual mice (green and purple lines are examples of individual trajectories). b SR model equations and their approximate analytical solutions. The SR model (red line) captures c the mean SnC abundance, d standard deviation of SnC abundance, e skewness, and f shape of the distributions among equal-aged individuals, and g correlation between subsequent measurements on the same individuals. TBL was normalized to give a mean abundance of 1 at young ages. Maximum-likelihood parameters for the SR model are: η = 0.15 day−1 year−1, β = 0.27 day−1, κ = 1.1, ε = 0.14 day−1. Pink lines in c: best-fit of all models without saturation mechanism iv, that have an age-related increase in SnCs, best-fit parameters are in Supplementary Note 1. Mean and standard error (shaded red, pink regions) are from bootstrapping. Source data are provided as a Source Data file.
The luciferase in these mice was introduced into one of the p16 loci, causing the mice to be heterozygous for p16, which may impair proper activation of the senescence program. We therefore also tested longitudinal measurements of SnCs based on another method. For this we obtained longitudinal data from Yamakoshi et al. 30, who measured SnC abundance by creating a transgenic mouse model with a human p16 gene tagged with luciferase, retaining the native p16 loci. Although this dataset has much fewer mice, it shows similar dynamics to the dataset of Burd et al.1 (Supplementary Note 1, Supplementary Fig. 2), suggesting a similar underlying dynamical process.
We tested how well each model describes the longitudinal SnC trajectories of Burd et al.1 by finding the maximum-likelihood parameters for each of the 16 models, adjusting for number of parameters (Supplementary Notes 1 and 2, Supplementary Tables 1–4). A principle emerges from this comparison: in order to capture the longitudinal dynamics, the mechanism must have rapid turnover of SnCs on the timescale of a few days in young mice, and it also must include mechanism (iv), which represents a decline in removal that depends on SnC abundance rather than directly on age. The simplest model that describes the data thus has only two interactions (Fig. 1c): SnC production rate increases linearly with age (mechanism i), and SnCs slow down their own removal rate (mechanism iv). We call this model the saturating removal model (SR model), whose equation is given in Fig. 2b.
The SR model captures the accelerating rise of mean SnC abundance with age in the longitudinal data (Fig. 2c and Supplementary Figs. 3, 4): as SnCs accumulate, they slow their own removal, leading to even higher SnC levels. The SR model also explains the SnC variability between individuals which accelerates with age (Fig. 2d), and the SnC distributions among equal-aged individuals (Fig. 2e), which are skewed to the right (Fig. 2f).
Importantly, the SR model captures the fact that SnC fluctuations become more persistent with age, as evidenced by an increasing correlation between subsequent measurements (Fig. 2g, F-test for linear regression, p-value 0.0047; F-statistic 16.5): individuals with higher (or lower) than average SnC levels stay higher (or lower) for longer periods with age. This increased persistence is due to the effect of SnCs on their own removal rate. Models without mechanism iv (saturation of removal) show a poor overall fit (pink lines in Fig. 2c, ΔBIC > 44.3).
SnC lifetime is days in young mice and weeks in old mice
The maximum-likelihood parameters of the SR model (listed in the caption of Fig. 2) provide quantitative predictions for SnC half-lives: SnC turnover is rapid in young mice, with a half-life of about 5 ± 1 days at 3 months of age; Turnover slows with age, so that SnC half-life is about 25 ± 6 days at 22 months.
We tested these predictions using experiments in mice by inducing SnCs and analyzing their dynamics. To induce senescence in mice lungs we used intra-tracheal bleomycin administration (Fig. 3a), a DNA-damaging agent that induces cellular senescence in the lung epithelium a few days after treatment5,31.
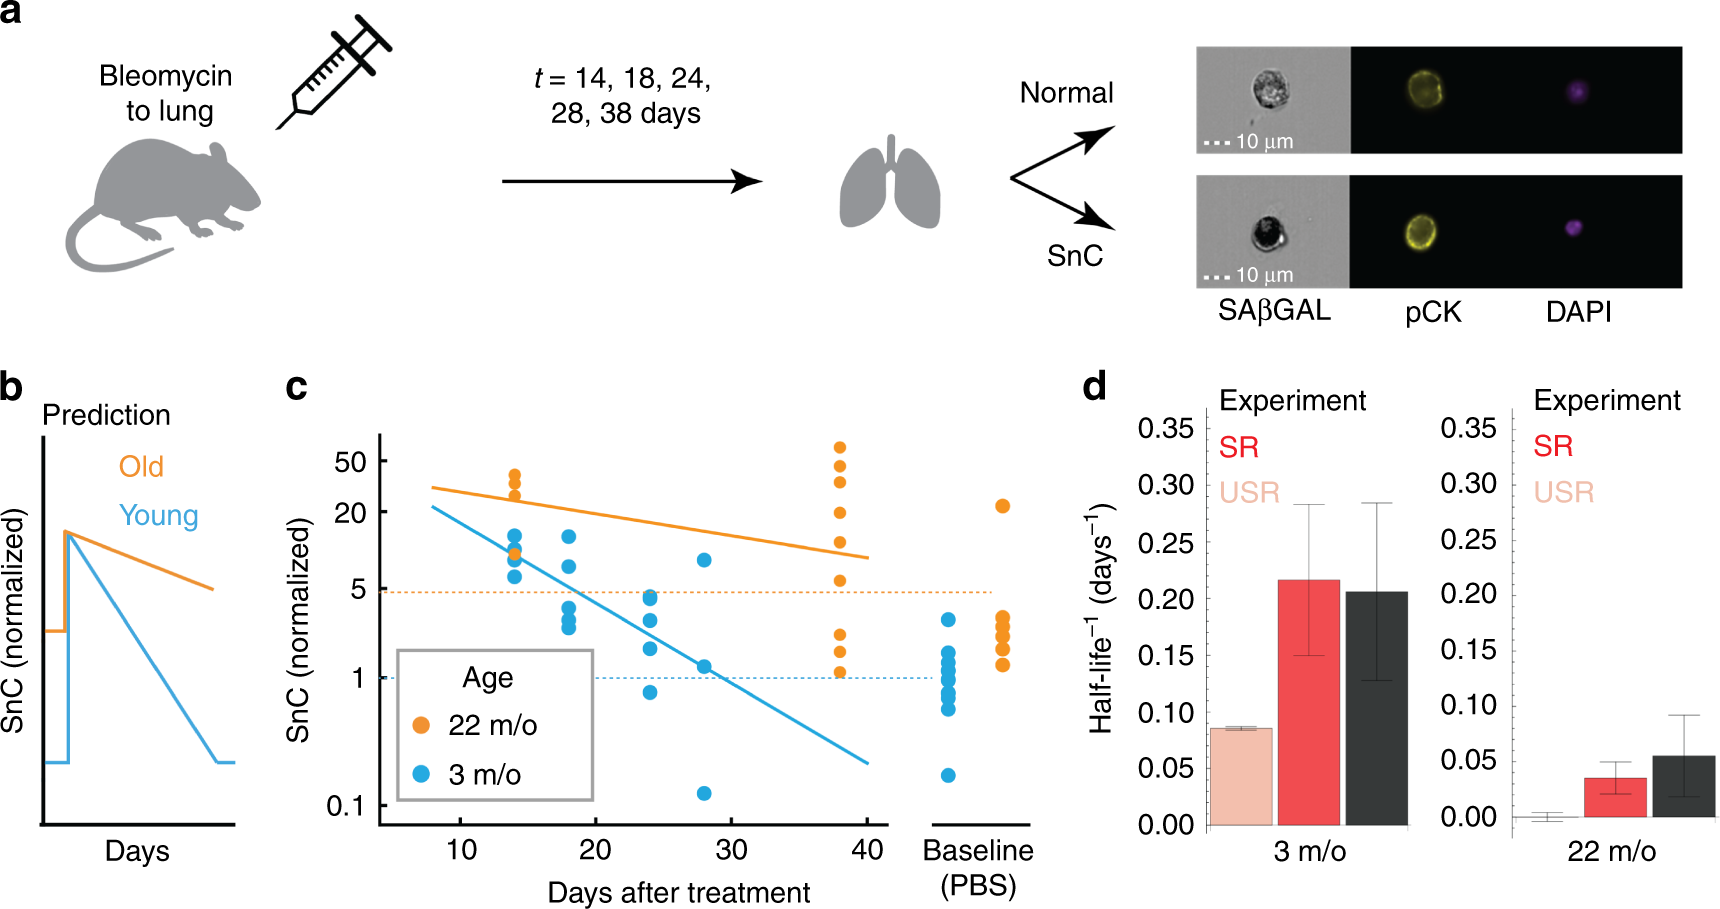
Fig. 3
SnC half-life measurements in mice support SR model predictions. a Bleomycin or PBS was introduced by intratracheal installation to mice on day 0. Lungs were analyzed on the indicated days thereafter. Representative images of lung cells analyzed by imaging flow cytometry show how senescent epithelial cells were identified, using SA-β-Gal, Pan-Cytokeratin (pCK), and DAPI staining. SnC removal rate was estimated by log-linear fit. b The SR model predicts that SnCs rapidly return to baseline in young mice and that removal is slower in old mice. c Fraction of SnCs in mouse lungs after treatment with bleomycin (1.5 U/kg). In young mice, SnC levels return to baseline with a half-life of about 5 days. In old mice, baseline SnC levels are about five-fold higher, and SnC removal rate is slower than in young mice . d SnC removal rates (half-life−1) for young and old mice (mean and standard error from bootstrapping, black) agree with the SR model predictions (red, mean and SE were calculated by bootstrapping, see the “Methods” section). The best-fit model without mechanism (iv), the USR model (mechanisms i + iii), shows a poor prediction (pink). For both ages, the USR prediction is different from the observed half-life with p < 0.01 from bootstrapping. Source data are provided as a Source Data file.
We quantified the fraction of senescent lung epithelial cells at different time points following bleomycin administration (Fig. 3a) using imaging flow cytometry. Epithelial SnCs were defined as cells positive for a senescent cell marker (SA-β-Gal) and an epithelial marker (pan-Cytokeratin, pCK). This cell population was also HMGB1 nuclear negative, as expected in SnCs5,32, and previously shown5 to correspond to non-proliferative cells (negative Ki67 assay, see Supplementary Note 3, Supplementary Fig. 6).
In 3-month-old mice, SnC levels decayed with a half-life of τ = 4.7 days (τ−1 = 0.21 +/− 0.07 days−1) and reached their baseline level within less than a month (Fig. 3b, c), as predicted. SnC levels in young mice lungs are thus in a rapid dynamic balance of production and removal.
To test the prediction that removal slows with age (Fig. 3b), we performed the bleomycin treatment in old mice (22-month old). In these mice, the baseline level of SnCs was about five-fold higher than in young mice (Fig. 3d). SnCs decayed with a half-life of τ = 18 days, τ−1 = 0.055 +/− 0.035 days−1), slower than that of young mice as predicted (p = 0.038 from bootstrapping, Fig. 3b).
These turnover measurements quantitatively agreed with the predictions of the SR model (Fig. 3d, Supplementary Note 4, Supplementary Fig. 7) with no additional fit. This agreement occurred despite the use of distinct SnC markers in the two data sets (SA-β-Gal in the bleomycin experiment vs. p16INK4A-luciferase in the longitudinal experiment), suggesting consistency between the measurement methods.
Our results suggest a core mechanism in which SnC production rate rises linearly with age, and SnCs slow their own removal (Supplementary Note 5, Supplementary Fig. 8). This slowdown of removal accelerates SnC accumulation with age. Slowdown of removal also amplifies fluctuations in SnC levels at old ages. This amplification, known as critical slowing down33,34, results in long-lasting differences among individuals at old ages. In other words, young mice have large spare removal capacity of SnC; old mice have much smaller spare removal capacity. This smaller removal capacity means that any addition of SnCs takes longer to remove, causing larger and more persistent variation in SnC levels among individuals (Fig. 2g).
The SR model quantitatively recapitulates the Gompertz law
In the remainder of the paper, we use mathematical analysis to explore the implications of these findings for the question of variability in mortality. Mortality times vary even in inbred organisms raised in the same conditions, demonstrating a non-genetic component to mortality35,36. In many species, including mice and humans, risk of death rises exponentially with age, a relation known as the Gompertz law37,38,39, and decelerates at very old ages. The Gompertz law has no known explanation at the cellular level.
To connect SnC dynamics and mortality, we need to know the relationship between SnC abundance and risk of death1. The precise relationship is currently unknown. Clearly, SnC abundance is not the only cause for morbidity and mortality. It seems to be an important causal factor because removing SnCs from mice increases mean lifespan25, and adding SnCs to mice increases risk of death and causes age-related phenotypes23. We therefore explored the simple possibility that death can be modeled to occur when SnC abundance exceeds a threshold level XC, representing a collapse of an organ system or a tipping point such as sepsis (Fig. 4a). Thus, death is modeled as a first-passage time process, when SnC cross XC. We use this assumption to illustrate our approach, because it provides analytically solvable results. We also show that other dependencies between risk of death and SnC abundance, such as sigmoidal functions with various degrees of steepness, provide similar conclusions.
.../...
.