• Log in with Facebook Log in with Twitter Log In with Google      Sign In    
  • Create Account
  LongeCity
              Advocacy & Research for Unlimited Lifespans

Photo
* * * * * 1 votes

coronavirus alternative views & theories

coronavirus covid-19

  • This topic is locked This topic is locked
914 replies to this topic

#541 gamesguru

  • Guest
  • 3,467 posts
  • 429
  • Location:coffeelake.intel.int

Posted 17 June 2020 - 08:33 PM

mortality rate of one quarter of one percent


What a load of farce, it's most likely in the 0.5-0.75% range at least.  This thing kills old people and overwhelms city hospitals like nobody's business.


I'm in favor of masks, I just doubt their implementation alone is enough.


  • Agree x 3
  • Good Point x 2
  • Pointless, Timewasting x 1
  • Ill informed x 1

#542 gamesguru

  • Guest
  • 3,467 posts
  • 429
  • Location:coffeelake.intel.int

Posted 18 June 2020 - 12:35 PM

"After more than 3 months of no meetings of 10 or more people, professional rugby has finally started back up again in New Zealand. 43,000 spectators, no need for physical distancing if there’s no cases in the whole country! Kia kaha - stay strong"

Two women traveled to New Zealand to see a dying relative. Now, they're the country's first coronavirus cases in 24 days.

What an absolute mockery the US & UK must be to the rest of the world.  Can't stop the spread, now exporting our germs, and all with the conservatives planning a much premature region-based re-opening :-D   We'd be in 1000x better shape if they hadn't politicized from this from the start by dredging epic volumes of chicanery and disinformation all throughout the case.


On an unrelated note here's an argument from the perspective that corporate bias against Hydroxychloroquine isn't worse than the newer Dexamethasone,

Dexamethasone, which has generally been prescribed to patients with certain inflammatory disorders and some types of cancer, is available as a generic from multiple drugmakers, so it'll be hard for any of the companies that make it (or their shareholders) to benefit significantly from the results.


On the other hand, the availability of a cheap treatment could hurt drugmakers, such as Gilead Sciences (Nasdaq: GILD), Eli Lilly (NYSE: LLY), Regeneron Pharmaceuticals (Nasdaq: REGN) and others, looking to develop effective treatments for COVID-19.


Of course, as those drugs may have different mechanisms of action than dexamethasone, some of them could eventually be authorized for use in combination with it, but studies to demonstrate whether such multi-drug treatment regimens are effective will take some time to set up and complete.


  • Dangerous, Irresponsible x 2
  • Informative x 2
  • Agree x 2

#543 Daniel Cooper

  • Member, Moderator
  • 2,653 posts
  • 632
  • Location:USA

Posted 18 June 2020 - 01:27 PM

"After more than 3 months of no meetings of 10 or more people, professional rugby has finally started back up again in New Zealand. 43,000 spectators, no need for physical distancing if there’s no cases in the whole country! Kia kaha - stay strong"

Two women traveled to New Zealand to see a dying relative. Now, they're the country's first coronavirus cases in 24 days.

What an absolute mockery the US & UK must be to the rest of the world.  Can't stop the spread, now exporting our germs, and all with the conservatives planning a much premature region-based re-opening :-D   We'd be in 1000x better shape if they hadn't politicized from this from the start by dredging epic volumes of chicanery and disinformation all throughout the case.


On an unrelated note here's an argument from the perspective that corporate bias against Hydroxychloroquine isn't worse than the newer Dexamethasone,


Don't you think that's a bit of an unfair comparison?  New Zealand has a total population of 4.9 million.  That's a relatively small state in the US, and it's an island. They don't have the extensive commercial ties and travel with China that the US and most of Europe has.  It's likely that they were not seeded with the high number of initial cases that the US and Europe saw.  Furthermore, the population density in New Zealand is very low.  Auckland is something like 1.7 million and pretty spread out. Wellington (their capital, which I've visited) is about 200k people.  We know that covid is really a pandemic of large urban centers and New Zealand isn't exactly covered over with those.


If you've got a small population, low population density, and a few number of initial cases, I think the task of getting a pandemic under control is significantly easier.  Wouldn't you agree?


Edited by Daniel Cooper, 18 June 2020 - 02:42 PM.

  • Disagree x 2
  • Good Point x 1

#544 pamojja

  • Guest
  • 2,841 posts
  • 722
  • Location:Austria

Posted 13 July 2020 - 10:36 PM

An other 20 days later the worldwide covid-19 situation compared to the 2017 influenza and flue mortality actualized: https://docs.google....dit?usp=sharing


30 days later updated again:
https://docs.google....dit?usp=sharing


  • Informative x 1

#545 pamojja

  • Guest
  • 2,841 posts
  • 722
  • Location:Austria

Posted 24 July 2020 - 02:15 PM

No getting around it.  Man is a religious animal. He will have his religion even if he's an atheist.


More like in the middle-ages: there is a plaque - therefore sinning - and prescribed austerity against. Or 'virtue signaling', as it is called these days. And witch-hunting on both sides. Welcome to the middle-ages.

Quote:
All-cause mortality during COVID-19: No plague and a likely signature of mass homicide by government response


Technical Report (PDF Available) · June 2020 with 81,091 Reads 

DOI: 10.13140/RG.2.2.24350.77125


Figures - uploaded by D. G. Rancourt

Author content

Content may be subject to copyright.


Abstract


The latest data of all-cause mortality by week does not show a winter-burden mortality that is statistically larger than for past winters. There was no plague. However, a sharp "COVID peak" is present in the data, for several jurisdictions in Europe and the USA. This all-cause-mortality "COVID peak" has unique characteristics:


• Its sharpness, with a full-width at half-maximum of only approximately 4 weeks;

• Its lateness in the infectious-season cycle, surging after week-11 of 2020, which is unprecedented for any large sharp-peak feature;

• The synchronicity of the onset of its surge, across continents, and immediately following the WHO declaration of the pandemic; and

• Its USA state-to-state absence or presence for the same viral ecology on the same territory, being correlated with nursing home events and government actions rather than any known viral strain discernment.


These "COVID peak" characteristics, and a review of the epidemiological history, and of relevant knowledge about viral respiratory diseases, lead me to postulate that the "COVID peak" results from an accelerated mass homicide of immune-vulnerable individuals, and individuals made more immune-vulnerable, by government and institutional actions, rather than being an epidemiological signature of a novel virus, irrespective of the degree to which the virus is novel from the perspective of viral speciation.


The paper is organized into the following sections:


  •  Cause-of-death-attribution data is intrinsically unreliable

  •  Year-to-year winter-burden mortality in mid-latitude nations is robustly regular

  •  Why is the winter-burden pattern of mortality so regular and persistent?

  •  A simple model of viral respiratory disease de facto virulence

  •  All-cause mortality analysis of COVID-19

  •  Interpreting the all-cause mortality “COVID peak”


Cause-of-death-attribution data is intrinsically unreliable


Assignment of cause of death, with infectious diseases and comorbidity, is not only technically

difficult (e.g., Simonsen et al., 1997; Marti-Soler et al., 2014) but also contaminated by

physician-bias, politics and news media.


This has been known since modern epidemiology was first practiced. Here is Langmuir (1976)

quoting the renowned pioneer William Farr, regarding the influenza epidemic of 1847:


Farr uses this epidemic to chide physicians mildly on their narrow views pointing out

that sharp increases were observed not only in influenza itself but in bronchitis,

pneumonia and asthma and many other non-respiratory causes, he states:


'… there is a strong disposition among some English practitioners not only to

localize disease but to see nothing but the local disease. Hence, although it is

certain that the high mortality on record was the immediate result of the

epidemic of influenza, the deaths referred to that cause are only 1,157.'


And, such bias is generally recognized by leading epidemiologists (Lui and Kendal, 1987):


… the decision to classify deaths into "pneumonia and influenza" is subjective and

potentially inconsistent. On one hand, the effect of influenza or influenza-related

pneumonia may be underestimated because underlying chronic diseases, particularly in

the elderly, are usually noted as the cause of death on the death certificate. On the

other hand, after influenza activity has been publicly reported there may be an

increased tendency to classify deaths as due to "pneumonia and influenza," thereby

amplifying the rate of increase in P&I deaths or, when a decline in influenza activity is

reported, a bias toward decreasing the classification of deaths related to "pneumonia

and influenza" may result. Surveys to evaluate these possibilities have not been done.


One can reasonably expect that in the current world of social media, with a World-Health-

Organization-declared (WHO-declared) “pandemic”, such bias will only be greater compared to

its presence in past viral respiratory disease epidemics.


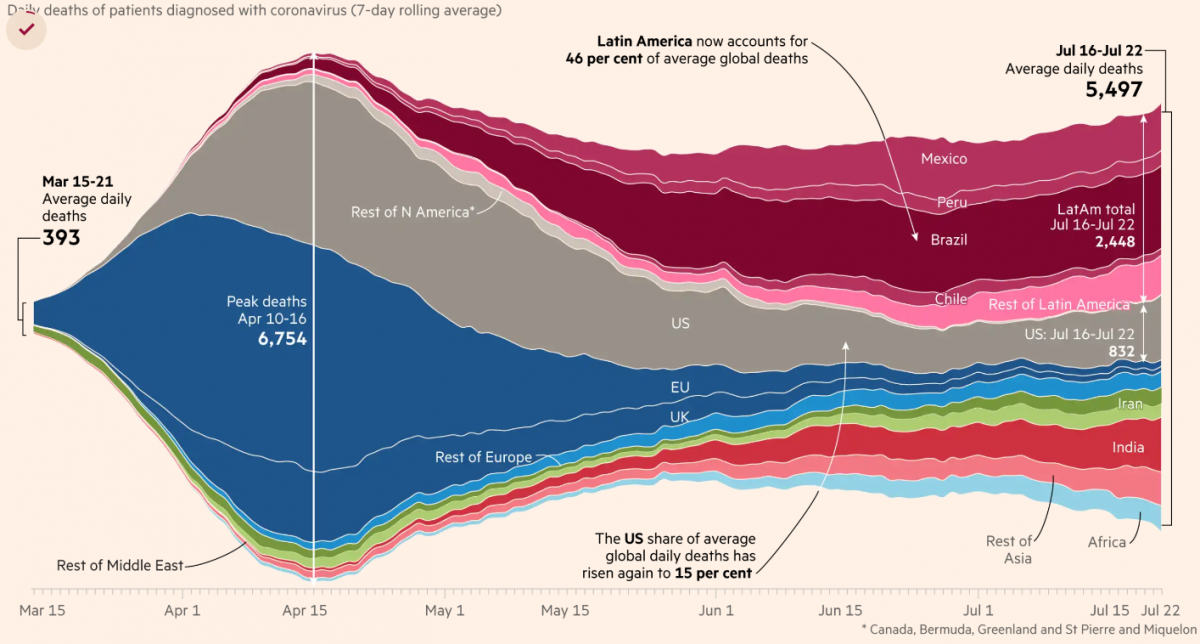
For example, it is difficult to interpret the synchronicity of the WHO declaration of COVID-19 as

a pandemic and the onset of the observed surge in reported COVID-19 cases and deaths as

being the product of either coincidence or extraordinary forecasting ability of the global health-

monitoring system:


Attached File  1.png   87.96KB   0 downloads


Figure 1: Globally reported COVID-19 cases, and reported COVID-19-assigned deaths, by day.

WHO data was accessed on 30 May 2020. The vertical lines in pencil indicate the date at which

the WHO declared the pandemic.


Attached File  2-.png   153KB   0 downloads


Figure 2: Globally reported new COVID-19 cases per day, discerning the continents. WHO data

was accessed on 30 May 2020. The vertical line in pencil indicates the date at which the WHO

declared the pandemic.


Instead, in light of past epidemics, it is more likely that this remarkable synchronicity

phenomenon arises from biased reporting, in the flexible context of using urgently

manufactured laboratory tests that are not validated, clinical assessments of a generic array of

symptoms, and tentative cause-of-death assignations of complex comorbidity circumstances.


That is why rigorous epidemiological studies rely instead on all-cause mortality data, which

cannot be altered by observational or reporting bias (as discussed in Simonsen et al., 1997; and

see Marti-Soler et al., 2014). A death is a death is a death.


Year-to-year winter-burden mortality in mid-latitude nations is robustly regular


Modern human mortality in mid-latitude temperate-climate regions is robustly seasonal.


Graphs of number of all-cause deaths per unit of time (month, week, day), in given regions,

have a yearly pattern, with a peak-to-trough amplitude of typically 10% to 30% of the trough-

baseline value, largely irrespective of the specific pathogens that populate the specific seasons.

High mortality occurs in winter, and is thus inverted in the Northern and Southern hemispheres

(e.g., Marti-Soler et al., 2014).


For the USA, the phenomenon is well illustrated in this figure from Simonsen et al. (1997):


Attached File  3.png   126.58KB   0 downloads


Figure 3: All-cause mortality, by week, for the USA, 1972 to 1993 (Simonsen et al., 1997; from

their Fig. 1).


In such a graph, the area under a peak, to its trough-level baseline, is the total number of yearly

winter-burden deaths above the trough baseline. The thus calculated yearly “excess” number of

deaths, here (in the era 1972-1993), is always approximately 8% to 11% of the total yearly

trough-baseline-level deaths, also approximately 8% to 11% of the yearly all-cause mortality.


This regular and seasonal “excess” mortality, or winter burden, has been an epidemiological

challenge to understand, although, starting with Farr, many epidemiologists originally

attributed it almost entirely to the seasonal influenza-like viral respiratory diseases.


Nonetheless, the agonizing difficulty to understand the cause(s) of this remarkably regular and

global (both hemispheres, but inverted) pattern persists, as illustrated in the words of Marti-

Soler et al. (2014) (references omitted):


Given that mortality from cancer showed virtually no seasonality pattern, the

seasonality of overall mortality is driven mostly by seasonality of both CVD

[cardiovascular diseases] and non-CVD/non-cancer mortality. For these conditions, and

particularly for CVD, exposure to cold is a plausible explanation for the observed

seasonality, given relationship of cold climate with latitude. Several longitudinal studies

have demonstrated that a decrease in outdoor temperature was associated with a rise

in all cause mortality. However, other latitude-dependent factors, such as dietary habits,

sun exposure (vitamin D levels) and human parasitic and infectious agents might also

play a role. The magnitude of the seasonal pattern for CVD mortality was highest than

that for all cause mortality. The seasonality of CVD mortality might be partly due to the

joint seasonality of several known CVD risk factors, as described previously. Similarly,

lifestyle factors such as diet and physical activity also tend to differ during summer and

winter months. Moreover, exposure to cold increases energy expenditure, peripheral

vasoconstriction and cardiac afterload, thus potentially triggering myocardial ischemia

and stroke. Finally, winter prone influenza infection might also be a trigger for CVD

deaths by exacerbating CVD conditions or due to secondary complications. This is likely

to be the case of concentration of air pollutants.


The seasonality of non-CVD/non-cancer mortality can relate to the facts that chronic

obstructive pulmonary disease and pneumonia are frequent diseases in this category

and that these disease are exacerbated by influenza, other influenza-like infections and

concentrations of air pollutants, which are all more frequent in winter. A few other

diseases in the non-CVD/non-cancer category also present a seasonal pattern, e.g.

depression, suicide, and oesophageal variceal bleeding.


Why is the winter-burden pattern of mortality so regular and persistent?


Even the seasonality of the pneumonia and influenza (“P&I”) part alone (which is a large part of

what Marti-Soler et al. quantify as “non-CVD/non-cancer mortality”) was not understood until a

decade ago. Until recently, it was debated whether the P&I yearly pattern arose primarily

because of seasonal change in virulence of the pathogens, or because of seasonal change in

susceptibility of the host (such as from dry air causing tissue irritation, or diminished daylight

causing vitamin deficiency or hormonal stress). For example, see Dowell (2001). In a sense, the

answer is “neither”.


In a landmark study, Shaman et al. (2010) showed that the seasonal pattern of respiratory-

disease (P&I) excess mortality can be explained quantitatively on the sole basis of absolute

humidity, and its direct controlling impact on transmission of airborne pathogens.


Lowen et al. (2007) demonstrated the phenomenon of humidity-dependent airborne-virus

contagiousness in actual disease transmission between guinea pigs, and discussed potential

underlying mechanisms for the measured controlling effect of humidity.


The underlying mechanism is that the pathogen-laden aerosol particles or aerosol-size droplets

are neutralized within a half-life that monotonically and significantly decreases with increasing

ambient absolute humidity. This is based on the seminal work of Harper (1961). Harper

experimentally showed that viral-pathogen-carrying droplets were inactivated within shorter

and shorter times, as ambient absolute humidity was increased.


Harper argued that the viruses themselves were made inoperative by the humidity (“viable

decay”), however, he admitted that the effect could be from humidity-enhanced physical

removal or gravitational sedimentation of the droplets (“physical loss”): “Aerosol viabilities

reported in this paper are based on the ratio of virus titre to radioactive count in suspension

and cloud samples, and can be criticized on the ground that test and tracer materials were not

physically identical.”


The latter (“physical loss”) seems more plausible to me, since absolute humidity would have a

universal physical effect of causing particle/droplet growth-by-condensation and gravitational

sedimentation (and, conversely, loss-by-evaporation and aerosolization), and all tested viral

pathogens have essentially the same humidity-driven “decay”. Furthermore, it is difficult to

understand how a virion (of any virus type) in a droplet would be molecularly or structurally

attacked or damaged by an increase in ambient humidity. A “virion” is the complete, infective

form of a virus outside a host cell, with a core of RNA or DNA and a capsid. No actual molecular

or other mechanism of the humidity-driven intra-droplet “viable decay” of a virion postulated

by Harper (1961) has, to date, been explained or studied, whereas gravitational sedimentation

(“physical loss”) is well understood.


In any case, the explanation and model of Shaman et al. (2010) is not dependant on the

particular mechanism of the absolute-humidity-driven decay of virions in aerosol/droplets.

Shaman’s quantitatively demonstrated model of seasonal regional viral epidemiology is valid

for either mechanism (or combination of mechanisms), whether “viable decay” or “physical

loss”.


The breakthrough achieved by Shaman et al. is not merely some academic point. Rather, it has

profound health-policy implications, which have been entirely ignored or overlooked in the

current coronavirus pandemic:


• It means that the seasonality of P&I mortality is directly driven by absolute-humidity-

controlled contagiousness of the viral respiratory diseases.

If my view of the mechanism is correct (i.e., “physical loss” rather than “viable decay”), then:

• It additionally implies that the transmission vector must be small aerosol particles in

fluid suspension in air, breathed deeply into the lungs, indoors; not hypothesized routs

such as actual fluid or fomite contact, and not large droplets and spit (that are quickly

gravitationally removed from the air, or captured in the mouth and digestive system).

• And it means that social distancing, masks, and hand washing can have little effect in

the actual epidemic spread during the winter season (see: Rancourt, 2020).


On the epidemiology modelling side, Shaman’s work implies that, rather than being a fixed

number (dependent solely on the spatial-temporal structure of social interactions in a

completely and variably susceptible population, and on the viral strain), the epidemic’s basic

reproduction number (R0) is predominantly dependent on ambient absolute humidity. For a

definition of R0, see HealthKnowlege-UK (2020): R0 is “the average number of secondary

infections produced by a typical case of an infection in a population where everyone is

susceptible.”


Shaman et al. showed that R0 must be understood to vary seasonally between humid-summer

values of just larger than “1” and dry-winter values typically as large as “4” (for example, see

their Table 2). In other words, the seasonal infectious viral respiratory diseases that plague

temperate-climate regions every year go from being intrinsically mildly contagious to virulently

contagious, due simply to the bio-physical mode of transmission controlled by atmospheric

absolute humidity, largely irrespective of any other consideration.


Furthermore, indoor airborne virus concentrations have been shown to exist (in day-care

facilities, health centres, and onboard airplanes) primarily as aerosol particles of diameters

smaller than 2.5 μm, such as in the work of Yang et al. (2011):


“Half of the 16 samples were positive, and their total virus

concentrations ranged from 5800 to 37 000 genome copies m−3. On

average, 64 per cent of the viral genome copies were associated with

fine particles smaller than 2.5 µm, which can remain suspended for

hours. Modelling of virus concentrations indoors suggested a source

strength of 1.6 ± 1.2 × 10⁵ genome copies m−3 air h−1 and a deposition

flux onto surfaces of 13 ± 7 genome copies m−2 h−1 by Brownian motion.

Over 1 hour, the inhalation dose was estimated to be 30 ± 18 median

tissue culture infectious dose (TCID50), adequate to induce infection.

These results provide quantitative support for the idea that the aerosol

route could be an important mode of influenza transmission.”


Such small particles (smaller than 2.5 μm) are part of air fluidity, are not subject to gravitational

sedimentation, and can therefore be breathed deeply into the lungs.


The next question is: How many such pathogen-laden particles are needed to cause infection in

a person of average immune-response capacity?


Yezli and Otter (2011), in their review of the minimal infective dose (MID), point out relevant

features:


• most respiratory viruses are as infective in humans as in tissue culture having optimal

laboratory susceptibility

• the 50%-probability MID (“TCID50”) has variably been found to be in the range 100−1000

virions

• there are typically 103−107 virions per aerolized influenza droplet with diameter 1 μm −

10 μm

• the 50%-probability MID easily fits into a single (one) aerolized droplet

For further background:

• A classic description of dose-response assessment is provided by Haas (1993).

• Zwart et al. (2009) provided the first laboratory proof, in a virus-insect system, that the

action of a single virion can be sufficient to cause disease.

• Baccam et al. (2006) calculated from empirical data that, with influenza A in humans,

“we estimate that after a delay of ~6 h, infected cells begin producing influenza virus

and continue to do so for ~5 h. The average lifetime of infected cells is ~11 h, and the

half-life of free infectious virus is ~3 h. We calculated the [in-body] basic reproductive

number, R0, which indicated that a single infected cell could produce ~22 new

productive infections.”

• Brooke et al. (2013) showed that, contrary to prior modeling assumptions, although not

all influenza-A-infected cells in the human body produce infectious progeny (virions),

nonetheless, 90% of infected cell are significantly impacted, rather than simply surviving

unharmed.


The above review means that all the viral respiratory diseases that seasonally plague temporal-

climate populations every year are extremely contagious for two reasons:


(1) they are transmitted by small aerosol particles that are part of the fluid air and fill virtually

 all enclosed air spaces occupied by humans, and


(2) a single such aerosol particle carries the minimal infective dose (MID) sufficient to cause

 infection in a person, if breathed into the lungs, where the infection is initiated.


This is why the pattern of all-cause mortality is so robustly stable and distributed globally, if we

admit that the majority of the burden is induced by viral respiratory diseases, while being

relatively insensitive to the particular seasonal viral ecology for this operational class of viruses.


This also explains why the pattern is inverted between the Northern and Southern

hemispheres, irrespective of tourist and business air travel and so one.


Virologists and geneticists see viral strains, mutations, and species (Alimpiev, 2019), like a man

with a hammer sees nails. Likewise, there are professional rewards for identifying new viral

pathogens and describing new diseases. For these reasons, scientists have not seen the forest

for the trees.


But the data shows that there is a persistent and regular pattern of winter-burden mortality

that is independent of the details, and that has a well constrained distribution of year to year

number of excess deaths (approximately 8% to 11% of the total yearly mortality, in the USA,

1972 through 1993). Despite all the talk of epidemics and pandemics and novel viruses, the

pattern is robustly constant.


An anomaly worthy of panic, and of harmful global socio-economic engineering, would need to

consist of a naturally caused yearly winter-burden mortality that is statistically greater than the

norm. That has not occurred since the unique flu pandemic of 1918 (Hsieh et al., 2006).


The three recent epidemics assigned as pandemics, the H2N2 pandemic of 1957, the H3N2

pandemic of 1968, and the H1N1 pandemic of 2009, were not more virulent (in terms of yearly

winter-burden mortality) than the regular seasonal epidemics (Viboud et al., 2010; Viboud et

al., 2006; Viboud et al., 2005). In fact, the epidemic of 1951 was concluded to be more deadly,

on the basis of P&I data, in England, Wales and Canada, than the pandemics of 1957 and 1968

(Viboud et al., 2006).


A simple model of viral respiratory disease de facto virulence


In the face of the persistent and regular pattern of winter-burden mortality, one is tempted to

propose that the specific (structural, molecular, and binding) properties of the particular

respiratory disease viral pathogen are not as determinative of mortality as virologists suggest.


Instead, it is possible that mortality, in a given population exposed to these highly contagious

viral pathogens that invade the lungs, is predominantly controlled by the population’s

distribution of immune-system capacity and preparedness.


A viral load enters the lungs. Once the viral antigen is recognized, an immune response is

mounted.1 A dynamic “war” ensues between the virus reproducing and spreading by infecting

cells on the lining of the lungs, and the immune system doing everything it can to identify,

locate and destroy infected cells before the said infected cells successfully can be productive of

the virus.


The immune response is extraordinarily demanding of the body’s metabolic energy resources

(which is why you “feed a cold”, “rest”, and “stay warm”). The demand in metabolic energy is

prioritized, and can compete with the demands of essential bodily functions and immune

responses to other pathogens. This is why individuals with “aging” diseases and comorbidity

conditions are particularly at risk: their rate of metabolic energy supply to the immune-system

is limited by their co-conditions, and the demand is not met at a sufficiently high rate to win the

“war”. See: Straub (2017); Bajgar et al. (2015).


In a simple view of the infection (which I propose for illustration), a given individual, having a

given state of health, can only provide metabolic energy to the immune system up to some

maximum rate of supply, during the crucial stage of the “war”. Call this “rate of energy supply

for the immune response”: RS. RS is in units of energy per unit time, J/s, or calories per second.


If RS is sufficient to “win the war”, and is sustained long enough, then the individual recovers

from the infection, and the immune system stores a molecular memory of the viral antigen,

which greatly reduces energy demand for future immune responses to attacks from the same

or sufficiently similar virus. If RS is insufficient then the individual succumbs to the virus and

dies.


Therefore, the seasonal virus can be characterized as having a virus-specific value of RS, RSv,

which is the RS threshold for survival of the infected person. If RS > RSv, then the person

recovers. If RS < RSv, then the person dies. The larger the RSv, the more virulent is the virus,

and vice versa.


1 See: “The immune system: Cells, tissues, function, and disease”, medically reviewed by Daniel Murrell, MD on

January 11, 2018 — Written by Tim Newman, at medicalnewstoday.com, accessed on 1 June, 2020.

https://www.medicaln...articles/320101


A given human population (national or regional) will have a given distribution of RS values

associated with the individual members of the population.


Mathematically, this distribution can be represented as a probability density of RS values. A

probability-density value has units of number of persons per unit interval of RS. The total area

under the probability density curve is the population, of the nation or region.


Figure 4 illustrates three hypothetical distributions of RS values, in three different populations

of equal size. Here: “Germany” (solid-blue line) is for a current Western population, not having

a particularly large elderly population; “Italy” (dashed-blue line) is for a current Western

population having a large elderly population; and “Stressed” (solid-red line) is for a population

of individuals subjected to high metabolic (or health) stress, such as might have been the case

in 1918 England.


Such health stress can arise from nutritional deficiency, essential nutrient or vitamin efficiency,

high levels of environmental stressor-agents, toxins, or pathogens, shelter deficiency (“fuel

poverty”), oppressive working conditions, social-dominance oppression, substance abuse

causing organ damage, and so on. There is a vast literature on these factors. As one anchor

point, see: Sapolsky (2015); Sapolsky (2005).


Attached File  4.png   132.62KB   0 downloads


Figure 4: Probability densities of RS values, for three populations of equal size but differing in

health-stress levels and health vulnerabilities, as explained in the text. The three vertical lines,

drawn in pencil and labelled “1”, “2” and “3”, show three different virus-specific values of RSv,

as explained in the text. The hatched areas are the fractions (of total area) representing the

mortality fractions for the less virulent virus having RSv value labelled “1”.


In this model, therefore, comparative mortality between populations, for a given viral

pathogen, is determined by the different health states (distributions of RS values of the

individuals) of the compared infected populations.


This is for the full cycle of infection and recovery. It says little about both the death rates on a

daily basis and age distributions, which depend on the natural or forced spread of the infection,

which in turn is not necessarily uniform in time and space but rather can target particular

segments of the population, such as people confined in institutions.


Furthermore, the distribution of RS values for a given population can change significantly during

the course of an epidemic, if vulnerable segments are subjected to additional health stressors,

for example.


All-cause mortality analysis of COVID-19


In light of the above background and conceptual tools, we can now examine data for COVID-19,

to date. For good reason (as per above), we ignore death-attributed data and model

deconvolutions of P&I deaths versus other deaths deemed to be seasonal for reasons unrelated

to the seasonal viral pathogens. We concentrate on all-cause mortality, by week.


All-cause mortality is not susceptible to bias, and is currently available for several jurisdictions.

We use the raw data without any manipulation, and we do not modify the data to “correct” for

changes in total population, or for changes in age structure of a population.


For the data, we rely on the CDC (USA), national institute data for England and Wales, and the

graphical compilations of the EuroMOMO hub. We use only the latest weeks that are reported

as complete (“>100%”, CDC) or reported to be of sufficient quality to publish. Unfortunately,

some jurisdictions such as Canada can be characterized as slow and refractory to requests.


Attached File  5.png   348.43KB   0 downloads


Figure 5 shows all-cause mortality by week for England and Wales, starting in 2010. The sudden

single-week drops are book-keeping and death-certification-delay inconsistencies, which are

counted in the following week(s). The red vertical line indicates the date at which the WHO

declared the pandemic.


In declaring the pandemic, the WHO Director-General, Tedros Adhanom, put it this way, among

other things:


2 “WHO Director-General's opening remarks at the media briefing on COVID-19 - 11 March 2020”,

https://www.who.int/...ia-briefing-on-

covid-19---11-march-2020


[…] In the days and weeks ahead, we expect to see the number of cases, the

number of deaths, and the number of affected countries climb even higher. […]

And we have called every day for countries to take urgent and aggressive

action. We have rung the alarm bell loud and clear. […]

This is not just a public health crisis, it is a crisis that will touch every sector –

so every sector and every individual must be involved in the fight.

I have said from the beginning that countries must take a whole-of-

government, whole-of-society approach, built around a comprehensive

strategy to prevent infections, save lives and minimize impact. […]

I remind all countries that we are calling on you to activate and scale up your

emergency response mechanisms; Communicate with your people about the

risks and how they can protect themselves – this is everybody’s business; Find,

isolate, test and treat every case and trace every contact; Ready your hospitals;

[…] [my emphasis]


Adhanom’s words either were the most remarkable public health forecast ever made for

England and Wales (and many jurisdictions in the world, see below), or something else might

explain the sharp peak in all-cause mortality that immediately followed his declaration.


Importantly, the total number of winter-burden all-cause “excess” deaths for the season ending

in 2020 (area above the summer baseline) is not statistically larger than for past years, and it

remains to be seen how low the summer 2020 trough will be.


What can be called “the COVID peak” is a narrow feature (Figure 5). Relative to the summer

baseline, the full-width at half-maximum of the peak is approximately 5 weeks. It has the

distinction of being late in the infectious season, and of climbing far above the broader winter-

burden hump.


This “COVID peak” is a unique event in the epidemiological history of England and Wales. Does

this unique feature arise from an unusually novel viral pathogen, or does it arise from the

unique, unprecedented and massive government response to the WHO declaration of a

pandemic?


Note that such a “COVID peak” does not imply intrinsic virulence of the virus. It only means that

the deaths of vulnerable persons, or persons made vulnerable, occurred in a short time span.

For example, those who would have died in the next few or more weeks or months can have

their deaths accelerated by human intervention, or those who are still recovering from a viral

infection can be thrust into more precarious and stressful living conditions.


An analogous “COVID peak” occurred in the EuroMOMO hub data for Europe (Figure 6). Here

again, the total number of winter-burden all-cause excess deaths for the season ending in 2020

(area above the summer baseline) is not statistically larger than for past years, and the date of

declaration of the pandemic is shown by a vertical red line.


Attached File  6.png   140.31KB   0 downloads


Figure 6: All-cause mortality by week EuroMOMO hub data for Europe, accessed on 1 June

2020. The date of declaration of the pandemic is shown by a vertical red line.


What looked like a concluding and “mild” 2020 season turned into a “COVID peak” immediately

after the WHO declared the pandemic.


Let us next move to the USA, where both national and state-by-state current data is readily

available, thanks to the CDC.


Attached File  7.png   277.11KB   0 downloads


Figure 7 shows all-cause mortality by week for the USA, starting in 2014. Here the summer

baseline is at approximately 46 K to 52 K deaths per week, increasing with the increase in total

population. The red vertical line indicates the date at which the WHO declared the COVID-19

pandemic. The hatched or gray-fill

areas represent the all-cause winter-burden deaths for each year.


Here, again, we see that the total number of winter-burden all-cause deaths for the season

ending in 2020 (area above the summer baseline) is not statistically larger than for past recent

years. There is no evidence, purely in terms of number of seasonal deaths, to suggest any

catastrophic event or exceptionally virulent pathogen. There was no “plague”. The winter

burden, in these years, is consistently in the range of approximately 6% to 9% of total yearly all-

cause mortality, and the year to year variations are typical of historic variations.


On the other hand, there is again a “COVID peak”, which has the following unique features:


• It is remarkably sharp or narrow, having a full-width at half-maximum of the peak,

relative to the summer baseline, of approximately only 4 weeks. By comparison, the

sharp peaks in the infectious seasons ending in 2015 and 2018 have such full-widths of

14 and 9 weeks, respectively.

• It occurs later in the infectious season than any other large sharp peak ever seen for the

USA, surging after week-11 of 2020.

• Its surge occurs immediately after the WHO declared the pandemic, in perfect

synchronicity, as seen in both Europe, and England and Wales, which are an ocean apart

from the USA.


The “COVID peak” in the USA data arises from “hot spots”, such as New York City (NYC).


Attached File  8.png   221.78KB   0 downloads


Figure 8 shows the all-cause mortality by week for NYC, starting in 2013. The red vertical line

indicates the date at which the WHO declared the COVID-19 pandemic. The grey line is

simply the same data on a vertically expanded and shifted scale, for visualization.


The NYC data makes no epidemiological sense whatsoever. The “COVID peak” here, on its face,

cannot be interpreted as a normal viral respiratory disease process in a susceptible population.

Local effects, such as importing patients from other jurisdictions or high densities of

institutionalized or housed vulnerable people, must be in play, at least.


What is also striking is that some of the largest-population states in the USA, having large

numbers of measured and reported cases, and large numbers of individuals with the

antibodies, do not show a “COVID peak”. (Characteristic antibodies are produced and stored in

the bodies of individuals who were infected and recovered following their immune responses.


For example, see the antibody field study for California done by Bendavid et al., 2020).


This is shown for California in Figure 9, and for Texas in Figure 10.


Attached File  9.png   297.19KB   0 downloads


Figure 9: All-cause mortality by week for California, starting in 2013. The red vertical line

indicates the date at which the WHO declared the COVID-19 pandemic. The hatched or gray-fill

areas represent the all-cause winter-burden deaths for each year.


Attached File  10.png   451.55KB   0 downloads


Figure 10: All-cause mortality by week for Texas, starting in 2013. The red vertical line indicates

the date at which the WHO declared the COVID-19 pandemic. The hatched or gray-fill areas

represent the all-cause winter-burden deaths for each year.


Also, none of the seven states that did not impose a lockdown (Iowa, Nebraska, North Dakota,

South Dakota, Utah, Wyoming, and Arkansas) have a “COVID peak”.


The presence of a “COVID peak” is positively correlated with the share of COVID-19-assigned

deaths occurring in nursing homes and assisted living facilities, as per this map:


Interpreting the all-cause mortality “COVID peak”


Given the uniqueness of the all-cause mortality “COVID peak”

:

• Its sharpness, with a full-width at half-maximum of only approximately 4 weeks;

• Its lateness in the infectious-season cycle, surging after week-11 of 2020, which is

unprecedented for any large sharp-peak feature;

• The synchronicity of the onset of its surge, across continents, and immediately following

the WHO declaration of the pandemic; and

• Its USA state-to-state absence or presence for the same viral ecology on the same

territory, being correlated with nursing home events and government actions rather

than any known viral strain discernment.

Given the above review of knowledge about seasonal viral respiratory diseases:

• The robustly persistent and regular winter-burden patterns of all-cause mortality, across

the modern era of epidemiology, and across nations in two hemispheres;

• The newfound (2010) understanding that transmissivity is controlled by absolute

humidity, and that the transmission vector is small aerosol particles taken deeply into

the lungs;

• The increasing recognition of metabolic energy budgeting as the paradigm for

understanding death from infectious diseases with comorbidity conditions, while

recognizing that the immune system has hierarchical control over metabolic energy

budgeting, second only to cognition of external imminent danger; and

• The increasing understanding of the dominant role of metabolic stress (including stress

cognition, perceived stress) in depressing immune system response capacity.


I postulate that the “COVID peak” represents an accelerated mass homicide of immune-

vulnerable individuals, and individuals made more immune-vulnerable, by government and

institutional actions, rather than being an epidemiological signature of a novel virus,

irrespective of the degree to which the virus is novel from the perspective of viral speciation.


Finally, my interpretation of the “COVID peak” as being a signature of mass homicide by

government response is supported by several institutional documents, media reports, and

scientific articles, such as the following examples.


Two scientific articles are on-point:


• Hawryluck et al. (2004), on posttraumatic stress disorder (PTSD) arising from medical

quarantine.


• Richardson et al. (2020), on statistical proof that mechanical ventilators killed critical

COVID-19 patients.


Rest at Site... https://www.research...rnment_response

quote end

Leaving aside the middle-aged witch-hunt on both sides of the argument, 2 points seem to be very outstanding for apprehension:


1) The deffinite seasonal humitity controlled contagiousness of viruses: The next wave is as sure as are the yearly seasons. If possible, avoid nursing-homes.


2) If you're not there yet, get your immunity up. Social distancing and masks, apart from their superstitious 'virtue signaling', wont ultimatily protect from seasonal infections, but even weaken immunity in the long run.


  • dislike x 2
  • WellResearched x 1

#546 pamojja

  • Guest
  • 2,841 posts
  • 722
  • Location:Austria

Posted 24 July 2020 - 02:26 PM

A slight twist of the same seasonality theme:

Quote:

Here is a Coronavirus puzzle for you to ponder – A guest article


9th July 2020

A guest article


I was sent this piece on Vitamin D and COVID by a reader of this blog. I thought it was very good and asked them if they minded me posting it. They said fine, but they wish to remain anonymous. Not everyone likes the glare of publicity – with all the attending Trolling and insults that inevitably follow [you should read my in-box sometime].


Season, Latitude, and COVID-19 Severity


Here is a coronavirus puzzle for you to ponder.  For context, let’s look at how many people have died of COVID-19 in the USA (as of mid-June).  Websites give different totals, but it’s around 120,000, or about 360 per million of population.  So how many died in Australia?  102.  How many died in New Zealand?  22.  In both countries, the death rate is 4 per million.  That is an extraordinary contrast!


Wouldn’t public health officials like to know the cause of this difference?  Are the Antipodeans that much better at hand-washing and social distancing than the people of New York, Italy or Great Britain?  Do they share a highly-effective cure kept secret from the rest of the world?  Or is there another reason for the disparity?


Unlike the USA and other countries where the disease has taken a huge toll, the coronavirus arrived in Australia and New Zealand in mid-summer.  Most of the inhabitants of these two countries are descendants of pale-skinned British settlers (and convicts in the case of Australia).  Yet at the same time the death rate in Great Britain, the homeland of their ancestors, is over 600 per million.


This suggests that sunshine, and, specifically, the sunshine vitamin, are responsible for the difference.  If you look at the death rates throughout the world, it becomes apparent that countries in the southern hemisphere fared much better than countries north of the equator.

Actually, the division between countries with high death rates and low death rates is about the 37th parallel north.  According to Wikipedia, the 37th parallel is the dividing line between greater than average and less than average sun exposure.


So it appears that people living south of the equator, and south of the 37th parallel north, experienced, in general, higher levels of sun exposure and lower death rates from the coronavirus than those in the northern hemisphere north of the of the 37th parallel.


This explains the very low death rates observed in Africa. Many experts have forecast that the coronavirus would take a heavy toll in Africa because of poor healthcare infrastructure in much of the continent.  Yet this has not happened.  For example, death rates in Ghana, Nigeria, Kenya, Ivory Coast, Togo, South Sudan, Niger and Burkina Faso are between 2 and 3 per million.


Virtually all of the continent is south of the 37th parallel north and sub-Saharan Africa is close to the Equator.  It could be argued that the low death rate is an artifact of poor record keeping, but reasonably good data about another virus, Ebola, reached world attention, so high death rates from coronavirus would likely be evident.


The same is true in the Far East.  Indonesia, Malaysia, Singapore and Sri Lanka are near the equator and have coronavirus death rates per million of 8, 4, 4, and 0.5.  But this pattern breaks down when one looks at that most equatorial of nations, Ecuador.


Here the reported coronavirus death rate is about 223 per million.  Other major countries of the South American continent, Brazil, Peru, Chile and Bolivia, have per million death rates of 208, 208, 176, and 54, which is quite a contrast to those seen in Africa and Southeast Asia.  The disparity may arise from a greater susceptibility to the coronavirus among people with indigenous ancestry.


Support for this idea comes from the death rates in Argentina and Uruguay, which are 19 and 7, per million, respectively.  Unlike the rest of South America, the populations of these two countries are very largely of European ancestry, mostly Spanish and Italian.  Remember that while it was summer in Argentina and Uruguay, at the same time it was winter in Spain and Italy, where COVID-19 death tolls per million were 580 and 571, respectively.


This analysis supports the idea that the virulence of the coronavirus, as measured by death rate, varies inversely with sun exposure.  Where the coronavirus struck during the summertime, in the southern hemisphere, death rates were very low, in very marked contrast to countries in the higher latitudes of the Northern Hemisphere, where the coronavirus struck in mid-winter.  The cause proposed to explain this disparity is Vitamin D levels in the respective populations.   How does that work?


Vitamin D3 is created in the skin by the ultraviolet light in sunlight.  Before the advent of dietary supplements, sunlight was the only significant source of Vitamin D3.  Fatty fish is a natural dietary source. Vitamin D3 is transformed inside the body to calcidiol, 25(OH)D3, which is not a vitamin, but a hormone.


Calcidiol has a half-life in the body of 2 to 3 weeks, so serum levels decline if they are not continually replenished by sun exposure or dietary supplements.   Winters in the higher latitudes diminish sun exposure due to shorter days, lower sun angle (if the sun is lower than 45 degrees in the sky, little UV light makes it through the atmosphere), and the need to bundle up or stay indoors in cold weather.


About 15 years ago it was discovered that Vitamin D is critical to the proper function of the innate immune system.  Broadly, there are two kinds of immunity – innate and acquired.  The body acquires immunity when it creates antibodies in response to infection by a specific pathogen.  This is the principal behind vaccines – to trigger the creation of antibodies.


However, the body also has an innate immune system that responds to the wide range of pathogens to which it is exposed every day.  Recently it has been demonstrated that the innate immune system is the body’s principal defense against another viral disease – influenza. 


The annual wintertime outbreaks of influenza are triggered by declining levels of serum vitamin D in the host population.  That is why influenza doesn’t occur in the summer and is very uncommon in the tropics.


For in-depth discussion of innate immunity, Vitamin D3 and influenza, read the paper in Virology Journal titled “On the Epidemiology of Influenza” by John Cannell, et. al., and his earlier paper “Epidemic Influenza and Vitamin D” published in the journal Epidemiology and Infection.  Open access full text of both articles can be found on the internet on PubMed.


However, the COVID-19 coronavirus is not influenza, so the role of innate immunity and Vitamin D in the incidence and virulence of this disease must be established.  Given the very recent emergence of COVID-19, it is understandable that not very much research on the role of Vitamin D has been published.


However, one key paper has come out, which has been summarized in the website Grassroothealth.net/blog/first-data-published-covid-19-severity-vitamin-d-levels/.  The data are observational and the population of patients was 212, but the results are statistically significant. 


People with adequate levels of serum Vitamin D in their blood experienced mild bouts of COVID-19, while those with inadequate levels suffered ordinary, severe or critical cases.  The chart in the article illustrates these data.


Attached File  cv19-chart.jpg   70.93KB   0 downloads


The results of this study are exactly consistent with the idea that sun exposure is inversely correlated with the virulence of COVID-19.  When serum levels of Vitamin D are high, the disease is mild.  When they are low, the disease is severe.   Which then leads one to ask what are the specific effects of Vitamin D that reduce the severity of COVID-19 infection?


There are at least two.  Severe cases can be complicated by what is called a “cytokine storm.”  This is a severe over-reaction of the immune system that can be fatal.  Vitamin D is known to prevent this condition (see the above-referenced articles by John Cannell).  A second effect is related to the recent discovery that COVID-19 attacks blood vessels, in particular, the endothelium, which is the internal lining of vessels, causing widespread clotting1.


Research published in 2015 showed that Vitamin D3,  in the form that is created in the skin by UV light or taken as a dietary supplement, has a direct, protective effect on the endothelium 2 Because Vitamin D3 lasts in the body only a day or so before it is processed into calcidiol, one needs a daily dose of sunshine or supplement to maintain the protective effect on blood vessels.  It should be underscored that sunscreen blocks UV rays from reaching the skin and therefore diminishes the formation of Vitamin D.  The skin pigment melanin is a natural sun screen and has a similar effect.


What does this mean for people who want to protect themselves from the malign effects of COVID-19?  Vitamin D3 is not some untested off-label prescription drug or sketchy supplement: it is an essential hormone naturally produced in the human body by sunlight on the skin.

With enough sun, one’s body makes all that is necessary to counteract the virus.  But modern lifestyles can make it impossible for many people to get sufficient daily sun exposure in the summer, and during Minnesota winters it is physically impossible because the sun is too low in the sky, not to mention that it is too cold to take off your clothes.


Therefore, one needs a program of supplementation with Vitamin D3, which is readily available over the counter.  The question, of course, is how much.  Grassrootshealth has devoted considerable study to finding the answer, a good discussion of which can be found here 3 The coronavirus statistics I used are from the site Worldometers 4


1: https://www.sciencet...e-everything.ht.

2: https://journals.plo...al.pone.0140370.

3: https://www.grassroo...mendations-low/

3:: www.worldometers.info/coronavirus/#countries.

quote end

Also take a look at this BBC article: The people with hidden immunity against Covid-19


Edited by pamojja, 24 July 2020 - 02:37 PM.

  • dislike x 2
  • WellResearched x 1
  • like x 1

#547 pamojja

  • Guest
  • 2,841 posts
  • 722
  • Location:Austria

Posted 24 July 2020 - 05:44 PM

This potential for exponential growth is the most severe risk we have to consider.


The next 'exponential growth' is still a few months away. Prepare while you can. Though it will be self-limiting after about 1 month, as the former. And therefore of course not really exponential at all.


Attached File  Screenshot_2020-07-24.png   819.57KB   0 downloads


  • like x 1

#548 gamesguru

  • Guest
  • 3,467 posts
  • 429
  • Location:coffeelake.intel.int

Posted 24 July 2020 - 06:20 PM

So more Americans are dying of COVID than have died for an extended period due to any other war or pestilence.  Meanwhile mods here are calling mask requirements the will of health fascists, confusing stats and innate immunity. Literally just move somewhere not requiring masks if you feel that strongly against them. Thank you.


WDZJDkh.png


  • Good Point x 5
  • Ill informed x 2
  • Dangerous, Irresponsible x 1

#549 Daniel Cooper

  • Member, Moderator
  • 2,653 posts
  • 632
  • Location:USA

Posted 24 July 2020 - 06:22 PM

What's missing from your graphs?


Which ought to be by the way normalized for population size. The Civil War was about 600,000 deaths, but on a total population of only 30 million (1/10th of today's population) But, that's not the thing that is most obviously missing.


Edited by Daniel Cooper, 24 July 2020 - 06:24 PM.

  • Dangerous, Irresponsible x 5
  • Good Point x 2

#550 Hip

  • Guest
  • 2,396 posts
  • -447
  • Location:UK

Posted 24 July 2020 - 07:27 PM

The next 'exponential growth' is still a few months away. Prepare while you can. Though it will be self-limiting after about 1 month, as the former. And therefore of course not really exponential at all.


Nonsense, it is not self-limiting. Where did you read that exponential growth is self-limiting?


This is a system that has to be understood mathematically (requiring knowledge of exponential equations). 


Anyone who understands exponential equations will know that exponential growth is not self-limiting; it will grow until the whole system is saturated. 


The only way to prevent or slow the growth is by changing the dynamics and characteristics of the system, which is what social distancing, hand washing, working from home, not seeing friends, and other restrictions and interventions achieve.


Perhaps you have not been following the news, and so are unaware that interventions such as social distancing, hand washing, and working from home have been strongly encouraged from the early days of the pandemic. It is this which has stopped exponential growth, not the mathematically erroneous conceptions you have about exponential equations being self-limiting.


These interventions change the dynamics of the system, and so alter the exponential equations. In mathematics, this is kindergarten stuff.


Edited by Hip, 24 July 2020 - 07:28 PM.

  • Ill informed x 2

#551 pamojja

  • Guest
  • 2,841 posts
  • 722
  • Location:Austria

Posted 24 July 2020 - 08:20 PM

These interventions change the dynamics of the system, and so alter the exponential equations. In mathematics, this is kindergarten stuff.


Your kindergarden equations just didn't replicate anywhere in the real world. Nowhere, not even countries without restrictive lockdowns, like Sweden or Brazil. You can't point me to even just 1 single example of what we've seen the preceeding 3 months:


Screenshot_2020-07-24.png


Only from middle of March til middle of April there was an exceptional growth in exactly the US and the EU only, far from not-selflimited exponential. Nowhere repeated in scale anywhere else since. Same we'll probably see in fall again.


  • Pointless, Timewasting x 3

#552 gamesguru

  • Guest
  • 3,467 posts
  • 429
  • Location:coffeelake.intel.int

Posted 24 July 2020 - 09:04 PM

What's missing from your graphs?


Which ought to be by the way normalized for population size. The Civil War was about 600,000 deaths, but on a total population of only 30 million (1/10th of today's population) But, that's not the thing that is most obviously missing.


It still ranks up there with the top per capita killers, and with no indication of how long this might go on, the conservative shenanigans downplaying it are insidious and the utmost irrational.


  • Agree x 3
  • Ill informed x 2
  • Pointless, Timewasting x 1

#553 Hip

  • Guest
  • 2,396 posts
  • -447
  • Location:UK

Posted 24 July 2020 - 09:40 PM

Your kindergarden equations just didn't replicate anywhere in the real world. Nowhere, not even countries without restrictive lockdowns, like Sweden or Brazil.


What you are failing to understand is the substantial effects of the all the interventions that have been put in place to hamper coronavirus spread. You don't have to go into full lockdown to hamper viral spread, you can greatly reduce spread by many non-lockdown interventions such as:

  • Social distancing by 2 meters (or less in some countries)
  • Crossing the street to avoid others
  • Washing hands frequently, especially when you come home
  • Carrying a hand sanitizer with you, to regularly disinfect your hands
  • Becoming aware of when you touch your face, and aiming not to do this
  • Wearing masks or face coverings
  • Working from home, to eliminate any professional contact with other people in the office
  • Eliminating close contact with people on public transport because you are working from home
  • Seeing friends much less, to minimize your social contact with others
  • Spacing people out in public places such as bars and restaurants
  • Spacing people out in shops and supermarkets, or only allowing one person at a time into small shops
  • Getting food delivered to your home to avoid the need for supermarket visits
  • Banning large gatherings like football matches, music concerts, etc
  • Closing non essential services like hairdressers, manicurists, etc
  • Avoiding people if they display symptoms such as coughing
  • Voluntarily going into self-isolation when the first symptoms of coronavirus appear, to help prevent spread
  • Placing people into quarantine when they return from a high risk country
  • Testing people for high fever in airports and other areas

In the very early stages of the pandemic, nobody outside of China was doing any of these, because very few countries really took the pandemic seriously. So the pandemic initially spread very fast. But once the pandemic started killing thousands of people, and governments realized this was a serious situation, these mitigations were very quickly implemented. 


It is these mitigations which stopped the coronavirus exponential growth, not these nonsense ideas of self-limiting viruses that you got from that idiot Professor Nutcase, whose misinformed videos were banned by YouTube. 


You need to take some time to reflect upon and understand why these all interventions when added together can have a dramatic effect in slowing viral transmission. Stop listening to Professor Nutcase, and start reading quality science publications


Edited by Hip, 24 July 2020 - 09:53 PM.

  • Unfriendly x 2
  • Agree x 1

#554 Daniel Cooper

  • Member, Moderator
  • 2,653 posts
  • 632
  • Location:USA

Posted 24 July 2020 - 09:52 PM

Nonsense, it is not self-limiting. Where did you read that exponential growth is self-limiting?


This is a system that has to be understood mathematically (requiring knowledge of exponential equations). 


Anyone who understands exponential equations will know that exponential growth is not self-limiting; it will grow until the whole system is saturated. 


The only way to prevent or slow the growth is by changing the dynamics and characteristics of the system, which is what social distancing, hand washing, working from home, not seeing friends, and other restrictions and interventions achieve.


Perhaps you have not been following the news, and so are unaware that interventions such as social distancing, hand washing, and working from home have been strongly encouraged from the early days of the pandemic. It is this which has stopped exponential growth, not the mathematically erroneous conceptions you have about exponential equations being self-limiting.


These interventions change the dynamics of the system, and so alter the exponential equations. In mathematics, this is kindergarten stuff.


Anyone that understands dynamic systems will understand that infectious diseases are not truly described by an exponential equation.


There is a feedback mechanism that is not included in the exponential.  People are not bacteria.  We process information.  The number of deaths in a pandemic affects the behavior of the population being infected.  Even in the absence of mandated lock downs and masking.


Think about it for a moment.  If you heard there was a new disease that had killed 500 people in the UK, would behave differently if you instead heard that it had killed 500,000?  Of course you would.  You'd only leave your house when absolutely necessary.  And when you did go out, you'd take every precaution possible.  You can't capture that sort of behavior in an exponential.


In engineering terms, we'd say these infections obey an exponential relationship under the "small signal condition", i.e. the increase or decrease in the output is small enough that we can neglect it's effect on any feedback mechanism.  That will obviously not hold true for large deviations in the output (i.e. number of deaths). 


These sort of things will tend to be self limiting due to the inherent feedback mechanisms.  Though, that is not to say you won't have a lot of dead people before that comes into play. 


  • Ill informed x 3
  • WellResearched x 1
  • Disagree x 1

#555 pamojja

  • Guest
  • 2,841 posts
  • 722
  • Location:Austria

Posted 24 July 2020 - 09:55 PM

You need to take some time to reflect upon and understand why these all interventions when added together can have a dramatic effect in slowing viral transmission.


You can't name even one country without enforced lockdowns, where death-growth went exponential.


Wikipedia lists the following:

Countries and territories without lockdowns 	Ref

Belarus 	[276]
Iceland 	
Japan 	[270]
Malawi 	[273]
Nicaragua 	[272]
South Korea 	[271]
Sweden 	[268]
Taiwan 	[277]
Timor-Leste 	

United States 	

Arkansas 	[274][275]
Iowa
Nebraska
North Dakota
South Dakota
Wyoming

Of course there are many others. Additionally in many high-density slums were already drinking-water is scare, no additional hygiene was available. No quarantine. Or working from home for the vast informal sector in many countries. Not 1 country without strict meassures where the death rate showed exceptional growth anywhere.


Nor would you be able to point out, that those countries with the strictest meassures, like UK, Italy, Spain, ended up with the least growth in deaths.


Attached File  Screenshot_2020-07-25.png   42.21KB   1 downloads


Edited by pamojja, 24 July 2020 - 10:06 PM.

  • Ill informed x 3
  • Agree x 1

#556 Hip

  • Guest
  • 2,396 posts
  • -447
  • Location:UK

Posted 24 July 2020 - 10:06 PM

There is a feedback mechanism that is not included in the exponential.  People are not bacteria.  We process information.  The number of deaths in a pandemic affects the behavior of the population being infected.  Even in the absence of mandated lock downs and masking.


I am in agreement; this is what I am trying to explain. 


Pamojja is claming that pandemics are intrinsically self-limiting, and so there is nothing to worry about, and nothing to be done. Just let the virus do it's thing, and the pandemic will fizzle out, out of its own accord. Pamojja got this idea from a now-banned YouTube video by someone called Professor Knut Wittkowski, who it turns out is not actually a professor.


Pamojja claims that all the mitigations and behavioral changes which were put in place, such as those mitigations I listed in my post above, are not the cause of the pandemic slowdown. Rather, he claims that pandemics are intrinsically self-limiting.


This is incorrect. In the absence of any mitigations and behavioral changes, pandemics will grow exponentially. 


Edited by Hip, 24 July 2020 - 10:07 PM.

  • Unfriendly x 2
  • Agree x 1

#557 pamojja

  • Guest
  • 2,841 posts
  • 722
  • Location:Austria

Posted 24 July 2020 - 10:10 PM

Thats your conception. I always viewed the death rate in ralation to overal mortality, common seasonal fluctuation in excess mortality, and the history of respiratory infectious waves during the last 100 years. Always seasonaly self-limiting. Even the 1918 Spanish flu ravaged only 2 seasons. Killing most in India.


And my observations have been confirmed. While your prediction of exponential growth of death rate is nowhere seen.


Edited by pamojja, 24 July 2020 - 10:12 PM.

  • Ill informed x 2

#558 pamojja

  • Guest
  • 2,841 posts
  • 722
  • Location:Austria

Posted 24 July 2020 - 10:17 PM

Pamojja claims that all the mitigations and behavioral changes which were put in place, such as those mitigations I listed in my post above, are not the cause of the pandemic slowdown.

 
Throughout this thread I maintained that efficacy of lockdowns wont be able to be demonstrated, because they were always implemented with worsening of the situation, and thereby heavily confounded. Just as in countries without worsening and without any implementation.
 
I always also pointed to the unintented consequences of lockdowns, you're still categorically ignore:
 

https://en.wikipedia...pandemic#Famine

Famine

Main article: COVID-19 pandemic-related famines

The pandemic, alongside lockdowns and travel restrictions, has prevented movement of aid and greatly impacted food production. As a result, several famines are forecast, which the United Nations called a crisis "of biblical proportions",%5B634%5D or "hunger pandemic".%5B635%5D It is estimated that without intervention 30 million people may die of hunger, with Oxfam reporting that "12,000 people per day could die from COVID-19 linked hunger" by the end of 2020.%5B636%5D%5B634%5D%5B637%5D This pandemic, in conjunction with the 2019-20 locust infestations and several ongoing armed conflicts, is predicted to form the worst series of famines since the Great Chinese Famine, affecting between 10 and 20 percent of the global population in some way.%5B638%5D 55 countries are reported to be at risk, with three dozen succumbing to crisis-level famines or above in the worst-case scenario.%5B639%5D 265 million people are forecast to be in famine conditions, an increase of 125 million due to the coronavirus pandemic.%5B636%5D


In the absence of any mitigations and behavioral changes, pandemics will grow exponentially.


Leaving aside the middle-aged witch-hunt on both sides of the argument, 2 points seem to be very outstanding for apprehension:
 

1) The deffinite seasonal humitity controlled contagiousness of viruses: The next wave is as sure as are the yearly seasons. If possible, avoid nursing-homes.


2) If you're not there yet, get your immunity up. Social distancing and masks, apart from their superstitious 'virtue signaling', wont ultimatily protect from seasonal infections, but even weaken immunity in the long run.


Edited by pamojja, 24 July 2020 - 10:27 PM.


#559 Hip

  • Guest
  • 2,396 posts
  • -447
  • Location:UK

Posted 24 July 2020 - 10:30 PM

Thats your conception. I always viewed the death rate in ralation to overal mortality, common seasonal fluctuation in excess mortality, and the history of respiratory infectious waves during the last 100 years. Always seasonaly self-limiting. Even the 1918 Spanish flu ravaged only 2 seasons. Killing most in India.


And my observations have been confirmed. While your prediction of exponential growth of death rate is nowhere seen.


It is not my conception. You have consistently stated both on this forum and on Phoenix Rising than you believe the numerous mitigations put in place, and the lockdowns, were not responsible for quelling the pandemic. 


Instead you believe that the pandemic is intrinsically self-limiting, and you think all mitigations are a waste of time and have no effect.  


  • Ill informed x 2

#560 Daniel Cooper

  • Member, Moderator
  • 2,653 posts
  • 632
  • Location:USA

Posted 24 July 2020 - 11:48 PM

What's missing from your graphs?


Which ought to be by the way normalized for population size. The Civil War was about 600,000 deaths, but on a total population of only 30 million (1/10th of today's population) But, that's not the thing that is most obviously missing.


Well, since games hasn't showed back up and some of you have chosen to label my question as "Dangerous, Irresponsible", I'll answer it myself.


So, what's clearly missing from these graphs are the deaths from the 1918 pandemic.  Why would they skip such an obviously germane comparison?  Because those graphs have a goal, and it is not to inform.


The 1918 pandemic killed about 675,000 people.  Most of that was in a 4 month period in the summer. Had you put that data on the graph, it would have completely overshadowed our covid pandemic to date.  And that would have been without renormalizing it to our current population.  If I scale those deaths to today's population, that would be the equivalent of 2.169 million deaths.


And of course, they failed to scale all the other deaths to our current population.  According to the 1860 census, there were about 31 million people in the country at that time.  The US civil war caused 618,222 deaths on both sides.  That is the number in that graph.  But of course, that's on a population less than 1/10ths of today's.  Scaled to our current population that's 6.6 million dead.


There are similar scaling issues with all the other figures graphed. 


Clearly anyone that actually wanted to genuinely inform the reader would have addressed these glaring deficiencies.  So, the only conclusion is that informing the reader was not their goal.


How are we ever going to reach honest conclusions if we can't even be honest with the historical data?


  • Pointless, Timewasting x 5
  • WellResearched x 1
  • like x 1

#561 pamojja

  • Guest
  • 2,841 posts
  • 722
  • Location:Austria

Posted 25 July 2020 - 08:24 AM

Throughout this thread I maintained that efficacy of lockdowns wont be able to be demonstrated, because they were always implemented with worsening of the situation, and thereby heavily confounded. Just as in countries without worsening and without any implementation.
 
I always also pointed to the unintented consequences of lockdowns, you're still categorically ignore:


It is not my conception. You have consistently stated both on this forum and on Phoenix Rising than you believe the numerous mitigations put in place, and the lockdowns, were not responsible for quelling the pandemic. 


Instead you believe that the pandemic is intrinsically self-limiting, and you think all mitigations are a waste of time and have no effect.  


All my post here in this thread and PR are still there available for you to be quoted. And I did link to studies that in many countries the reduction of numbers already occured slightly before the implementation of lockdowns. So why you don't quote and just repeat lies?


In the very post above I again warned of tire untintented consequences of lockdowns, you still ignore many month later. How could up to 12,000 dying from hunger till the end of 2020 - I warned from months ago - be construed to having said lockdowns have no effect?!?


https://en.wikipedia...pandemic#Famine


Famine

Main article: COVID-19 pandemic-related famines


The pandemic, alongside lockdowns and travel restrictions, has prevented movement of aid and greatly impacted food production. As a result, several famines are forecast, which the United Nations called a crisis "of biblical proportions",%5B634%5D or "hunger pandemic".%5B635%5D It is estimated that without intervention 30 million people may die of hunger, with Oxfam reporting that "12,000 people per day could die from COVID-19 linked hunger" by the end of 2020.%5B636%5D%5B634%5D%5B637%5D This pandemic, in conjunction with the 2019-20 locust infestations and several ongoing armed conflicts, is predicted to form the worst series of famines since the Great Chinese Famine, affecting between 10 and 20 percent of the global population in some way.%5B638%5D 55 countries are reported to be at risk, with three dozen succumbing to crisis-level famines or above in the worst-case scenario.%5B639%5D 265 million people are forecast to be in famine conditions, an increase of 125 million due to the coronavirus pandemic.%5B636%5D


Edited by pamojja, 25 July 2020 - 08:40 AM.


#562 gamesguru

  • Guest
  • 3,467 posts
  • 429
  • Location:coffeelake.intel.int

Posted 25 July 2020 - 12:44 PM

So, what's clearly missing from these graphs are the deaths from the 1918 pandemic.


Nothing but a humdrum comparison to a bygone age.


Per capita deaths in the Iraq war pale in comparison to that of WWI, yet everyone thinks it unjust for the men in 2003 to have perished.  No one says, well it's no big deal cause in 1918 tons more people died per capita, so let us go to war again.  They rather say, war is unacceptable in any form, and I shall demand more of our modern standards. At least if they believe in progress, they do


  • Good Point x 3
  • Ill informed x 2

#563 Daniel Cooper

  • Member, Moderator
  • 2,653 posts
  • 632
  • Location:USA

Posted 25 July 2020 - 01:02 PM

Nothing but a humdrum comparison to a bygone age.


Per capita deaths in the Iraq war pale in comparison to that of WWI, yet everyone thinks it unjust for the men in 2003 to have perished.  No one says, well it's no big deal cause in 1918 tons more people died per capita, so let us go to war again.  They rather say, war is unacceptable in any form, and I shall demand more of our modern standards. At least if they believe in progress, they do


So let me get this straight.  You post graphs of historical deaths due to various wars for the sole purpose of showing how bad covid is in comparison.  When you get called on the fact that your graph is total BS you reply "Nothing but a humdrum comparison to a bygone age".  A comparison that you initiated.


That about right?


Edited by Daniel Cooper, 25 July 2020 - 04:24 PM.

  • Pointless, Timewasting x 3
  • Good Point x 2

#564 Hip

  • Guest
  • 2,396 posts
  • -447
  • Location:UK

Posted 25 July 2020 - 02:32 PM

And I did link to studies that in many countries the reduction of numbers already occured slightly before the implementation of lockdowns.


So do you still believe that the lockdowns and all the other mitigations (like social distancing, hand washing, etc) do not help reduce viral transmission, and do not help reduce the growth of the pandemic?


Or have you changed your mind, and are you now willing to concede that these mitigations have been successful in controlling the pandemic?


Please explain your position and beliefs, in one ot two short sentences.


Edited by Hip, 25 July 2020 - 02:32 PM.

  • Pointless, Timewasting x 2

#565 gamesguru

  • Guest
  • 3,467 posts
  • 429
  • Location:coffeelake.intel.int

Posted 25 July 2020 - 10:28 PM

So let me get this straight.  You post graphs of historical deaths due to various wars for the sole purpose of showing how bad covid is in comparison.  When you get called on the fact that your graph is total BS you reply "Nothing but a humdrum comparison to a bygone age".  A comparison that you initiated.


That about right?


Lol, you didn't call out anything but your own lack of genius


If you can't acknowledge the fact that wars and disease generally have declined SUBSTANTIALLY in modern ages due to medicine and declines in civil conflict, then you really aren't anything but biased.


  • Unfriendly x 4
  • Good Point x 3

#566 Daniel Cooper

  • Member, Moderator
  • 2,653 posts
  • 632
  • Location:USA

Posted 26 July 2020 - 01:48 AM

Lol, you didn't call out anything but your own lack of genius


If you can't acknowledge the fact that wars and disease generally have declined SUBSTANTIALLY in modern ages due to medicine and declines in civil conflict, then you really aren't anything but biased.


Ah, then the point of your graph was that wars and disease have declined SUBSTANTIALLY in modern ages?


That's interesting.  Because putting the 1918 pandemic on that graph and norming it and the rest of the data to population would have shown that effect even more dramatically.   And, the death numbers from covid-19 would have fit well within that narrative.  After all, this is a major novel virus, and yet compared to the 1918 virus the US and the world has suffered far fewer causalities.  So we're agreed on that then?


And don't make me remind you again to avoid your ad hominem comments.


  • Pointless, Timewasting x 4
  • Good Point x 2

#567 pamojja

  • Guest
  • 2,841 posts
  • 722
  • Location:Austria

Posted 26 July 2020 - 10:42 AM

So do you still believe that the lockdowns and all the other mitigations (like social distancing, hand washing, etc) do not help reduce viral transmission, and do not help reduce the growth of the pandemic?


Beside throughout this thread pointing out the gross confounders with most countries, with or without lockdowns, making it impossible to prove, my opinion is even worse from your point of view. Months ago I only suspected that locking down healthy instead of unhealthy in the first time of history without any clear evidence of benefits, will have more economical and psychological side-effects which will cause multiple times more death. As Sweden chief epidemiologist Anders Tegnell once said: It is not Sweden doing the experiment, but the rest of the world.


Volluntary social distancing and hygiene are only made to appear to be part of that experimental bundle, but do have clear evidence in themself. Since Semmelweis times.


Now one can read it even on scensored wikipedia:


Famine


The pandemic, alongside lockdowns and travel restrictions, has prevented movement of aid and greatly impacted food production. As a result, several famines are forecast, which the United Nations called a crisis "of biblical proportions",[634] or "hunger pandemic".[635] It is estimated that without intervention 30 million people may die of hunger, with Oxfam reporting that "12,000 people per day could die from COVID-19 linked hunger" by the end of 2020.[636][634][637] This pandemic, in conjunction with the 2019-20 locust infestations and several ongoing armed conflicts, is predicted to form the worst series of famines since the Great Chinese Famine, affecting between 10 and 20 percent of the global population in some way.[638] 55 countries are reported to be at risk, with three dozen succumbing to crisis-level famines or above in the worst-case scenario.[639] 265 million people are forecast to be in famine conditions, an increase of 125 million due to the coronavirus pandemic.[636]


If one still believes and is endorsing this single overall devastating meassure with multiple times worse death-tolls (this economic crisis in some part of this world wont be over in even a decade), apart from ignorance, is really a crime against humanity.


Edited by pamojja, 26 July 2020 - 10:48 AM.

  • Pointless, Timewasting x 1

#568 gamesguru

  • Guest
  • 3,467 posts
  • 429
  • Location:coffeelake.intel.int

Posted 26 July 2020 - 01:40 PM

And don't make me remind you again to avoid your ad hominem comments.


If anyone here is struggling with ad hominems it would be you.  I recall a thread where the good fellow tried to accuse Trump of being a bad president, but you turned the source against it calling Chomsky a facist.  Chomsky's involvement in the Vietnam war in no way detracts from his valid analysis of President Trump.  Neither do your endlessly unintelligible red herrings


  • Off-Topic x 3
  • Good Point x 3
  • like x 1
  • Dangerous, Irresponsible x 1

#569 Mind

  • Life Member, Director, Moderator, Treasurer
  • 19,058 posts
  • 2,000
  • Location:Wausau, WI

Posted 25 September 2020 - 10:47 AM

The political nature of the COVID "pandemic", has been mentioned before and it continues to be proven day after day. If you are a violent rioter or protester you can do whatever you want and violate every and any "pandemic" regulation. If you are a mom sitting alone outside watching your son's football game without a mask, you get tazed and arrested. 


Edited by Mind, 25 September 2020 - 01:37 PM.

  • Good Point x 2
  • dislike x 1
  • Agree x 1

#570 Daniel Cooper

  • Member, Moderator
  • 2,653 posts
  • 632
  • Location:USA

Posted 25 September 2020 - 02:14 PM

Covid obviously has an independent reality outside of politics.  However, given that previously non-political things like Emmy Awards shows and NFL football games in this country have become highly political, I think we should all be shocked if this pandemic didn't have a significantly political aspect to it, particularly in an election year.


Also tagged with one or more of these keywords: coronavirus, covid-19

0 user(s) are reading this topic

0 members, 0 guests, 0 anonymous users