.
O P E N A C C E S S S O U R C E : Aging Cell
Abstract
Loci associated with longevity are likely to harbor genes coding for key players of molecular pathways involved in a lifelong decreased mortality and decreased/compressed morbidity. However, identifying such loci is challenging. One of the most plausible reasons is the uncertainty in defining long‐lived cases with the heritable longevity trait among long‐living phenocopies. To avoid phenocopies, family selection scores have been constructed, but these have not yet been adopted as state of the art in longevity research. Here, we aim to identify individuals with the heritable longevity trait by using current insights and a novel family score based on these insights. We use a unique dataset connecting living study participants to their deceased ancestors covering 37,825 persons from 1,326 five‐generational families, living between 1788 and 2019. Our main finding suggests that longevity is transmitted for at least two subsequent generations only when at least 20% of all relatives are long‐lived. This proves the importance of family data to avoid phenocopies in genetic studies.
1 INTRODUCTION
In contrast to the low heritability of human lifespan (Herskind et al., 1996; Kaplanis et al., 2018; Ruby et al., 2018; van den Berg, Beekman, Smith, Janssens, & Slagboom, 2017), human longevity is strongly heritable as illustrated by the familial clustering of survival into extreme ages (Berg, Rodríguez‐Girondo, et al., 2018; Dutta et al., 2013; Gudmundsson et al., 2000; Houde, Tremblay, & Vézina, 2008; Jarry, Gagnon, & Bourbeau, 2013; Pedersen et al., 2017; Perls et al., 2002; Schoenmaker et al., 2006; Sebastiani, Nussbaum, Andersen, Black, & Perls, 2016; Terry et al., 2004; van den Berg et al., 2019). Identifying loci associated with longevity is important because they likely to harbor genes coding for molecular pathways involved in a lifelong decreased mortality (Berg, Rodríguez‐Girondo, et al., 2018; van den Berg et al., 2019), decreased morbidity (Dutta et al., 2013; Terry et al., 2004), and compression of morbidity toward the end of the lifespan (Andersen, Sebastiani, Dworkis, Feldman, & Perls, 2012; Christensen, McGue, Petersen, Jeune, & Vaupel, 2008; Christensen et al., 2013). Currently, genome‐wide linkage and association studies (GWAS) identified a limited number of loci promoting longevity (Broer et al., 2015; Deelen et al., 2014; Flachsbart et al., 2009; Joshi et al., 2017; Partridge, Deelen, & Slagboom, 2018; Pilling et al., 2017; Sebastiani et al., 2017; Shadyab & LaCroix, 2015; Slagboom, Berg, & Deelen, 2018; Willcox et al., 2008), for example, the APOE and FOXO3A genes (more details can be found in current review papers [Partridge et al., 2018; Shadyab & LaCroix, 2015; Slagboom et al., 2018]). However, many of the identified loci could not be replicated in independent studies as yet. In addition, the largest and most recent longevity GWAS, based on cases belonging to the top 10% oldest survivors, again only replicated association of the APOE locus (Deelen et al., 2019).
One of the main reasons for the limited success of longevity genetic studies (Broer et al., 2015; Deelen et al., 2014, 2019; Flachsbart et al., 2016; Sebastiani et al., 2017; Willcox et al., 2008; Zeng et al., 2016) is the uncertainty in defining the heritable longevity trait itself (Berg et al., 2019; van den Berg et al., 2017). Given the increased life expectancy of the past 200 years due to nongenetic factors (improved hygiene, nutrition, and medication), there are likely many phenocopies among the long‐lived cases selected for our genetic studies (Oeppen & Vaupel, 2002; Vaupel, 1998). The presence of phenocopies is illustrated by the increase in centenarians in the United States between 1994 and 2012 from 1 in 10,000 to 1 in 5,000 (Sebastiani & Perls, 2012). To avoid phenocopies, family selection scores, such as the Family Longevity Selection Score (FLoSS) and the Family Excess Longevity (FEL) score, have been constructed (Kerber, Brien, Smith, & Cawthon, 2001; Sebastiani et al., 2009). The use of such scores is substantiated by novel studies which showed that including family history information can provide valuable information about an individual's genetic liability for a trait and is likely to increase the power to detect genetic loci (Gordon, 2005; Hujoel, Gazal, Loh, Patterson, & Alkes, 2019; Liu, Erlich, & Pickrell, 2017). The scores focus, in different ways, on selecting multiple family members with the same trait (Arbeeva et al., 2018; Berg, Rodríguez‐Girondo, et al., 2018; Kerber et al., 2001; Rozing et al., 2010; Sebastiani et al., 2009), and usually focus on a single group of relatives, such as parents (Berg, Rodríguez‐Girondo, et al., 2018; Rozing et al., 2010) or siblings (Sebastiani et al., 2009) of cases.
As the definition of heritable longevity was not yet established, the construction and application of the family selection scores have not yet been adopted as state of the art in longevity research. As such, the majority of genealogical (Deluty, Atzmon, Crandall, Barzilai, & Milman, 2015; Dutta et al., 2013; Gudmundsson et al., 2000; Houde et al., 2008; Jarry et al., 2013; Perls et al., 2002; Sebastiani et al., 2016; Willcox, Willcox, He, Curb, & Suzuki, 2006) and genetic studies (Broer et al., 2015; Deelen et al., 2014, 2019; Flachsbart et al., 2016; Sebastiani et al., 2017; Willcox et al., 2008; Zeng et al., 2016) focus only on single, and thus including sporadic, long‐lived individuals (singletons), with some exceptions focusing, for example, on parental age (Joshi et al., 2017; Pilling et al., 2017) or multiple siblings (Broer et al., 2015; Schoenmaker et al., 2006). In previous work, we showed that longevity defined as top 10% survivors or more extreme is transmitted to subsequent generations (van den Berg et al., 2019). With this, a consistent definition of longevity was provided that is also adopted in the largest longevity GWAS up to now (Deelen et al., 2019). In addition, we showed that every additional long‐lived relative independently contributes to the survival advantage of study participants, according to their genetic distance (van den Berg et al., 2019). As such, there is room to incorporate these novel insights into family selection scores to gain knowledge about the extent that longevity needs to cluster in families in order to include individuals with the heritable longevity trait and increase the power of genetic studies.
Here, we aim to establish the proportion of ancestral blood relatives that should be long‐lived (sex‐specific top 10% survivors of their birth cohort or more extreme) in order to observe a survival advantage in their descendants and incorporate these insights into a novel family score to define cases with the heritable longevity trait for inclusion in genetic studies. For our analyses, we use the data available in the Historical Sample of the Netherlands (HSN) for the period between 1860 and 1875 which is based on Dutch citizens (Berg, Dijk, et al., 2018; Mandemakers, 2000, 2010). We primarily identify cases who died beyond 80 years (N = 884, on average top 10% survivors of their birth cohort), allowing us to select on more extreme ages at death, and controls who died between 40 and 59 years (N = 442, 40th‐60th survival percentile) and who represent the range of average mortality from birth at that time. We extend this filial (F) 1 generation data with a parental and three descendant generations of individuallife course and mortality data and refer to the data as the HSN case/control dataset. We subsequently exclude groups with high rates of missing mortality information and where the majority was still alive (Figure S4). This study covers 37,825 persons from 1,326 three‐generational families (F1–F3) and contains F1 index persons (IPs), two consecutive generations of descendants (F2–F3), and two generations of spouses (F2–F3; Table 1). The dataset is unique in that it covers multiple generations and connects alive persons to at least two generations of deceased ancestors.
Table 1: Unable to reproduce it here.
2 RESULTS
2.1 Outline
We analyzed the data across multiple steps (Figure S5) in two phases. In the first phase, we used standardized mortality ratios (SMRs) to investigate the intergenerational transmission of longevity for cases (died beyond 80 years) and controls (died between 40 and 59 years) as defined in the original approach (Figure 1a), focusing on the F1 IPs and two generations of descendants.

Figure 1. Pedigree overview of the data structure. This figure illustrates the two approaches: (1) the original approach and (2) the combined approach. The original approach refers to the case and control group based on the F1 IPs where cases died at 80 years or older and controls died between 40 and 59 years (panel a). Panel b shows a pedigree of the data from the perspective of F3 children (combined approach). The combined approach refers to the dataset where we combined the cases and controls from the original approach and constructed a new case and control group in the F3 descendants. To this end, F3 descendants with ≥30% long‐lived ancestors were labeled as family cases and those without long‐lived ancestors as family controls. F3 spouses were left out of this figure, but this group was used to confirm a genetic enrichment in the F3 descendants.
In the second phase of our study (the combined approach), we combined original cases and controls and their descendants into one combined group and focused on the survival of the F3 descendants in relation to their F2 and F1 ancestral family members (Figure 1b). First, we constructed the Longevity Relatives Count (LRC) score. We used the LRC score to investigate the proportion of long‐lived (top 10% survivors of their birth cohort) F1 and F2 ancestors required for F3 descendants to express a survival advantage compared with members of the same birth cohort and sex (family method, Figure 1b). On the basis of these observations, we defined a new case and control group in F3, where we labeled F3 descendants with ≥30% long‐lived ancestors as family cases and those without long‐lived ancestors as family controls. Subsequently, these F3 family cases and controls were compared for their survival, that of their spouses (to investigate environmental influences), and for survival differences with the F3 descendants, selected to have at least one (singleton) long‐lived ancestor or at least one average‐lived ancestor. This means that they could have more than one long‐ or average‐lived ancestor but we actively selected for the presence of only one such ancestor. Figure S3a provides a conceptual overview of this selection. To this end, we selected either F3 descendants with at least one top 10% grandparent, at least one top 10% parent, or with grandparents who died between 40 and 59 years (their children (parents) resembled the general population). In a final step, we focused on the F3 descendants with at least one long‐lived parent and calculated LRC scores within this F3 group to determine whether parents transmitted their longevity more frequently if they were part of a long‐lived (LRC ≥ 0.30) family (Figure 1b). The analysis steps are summarized in Figure S5, and an overview of the available data per group and generation is shown in Table 1.
2.2 Longevity is transmitted in the case group and not in the control group
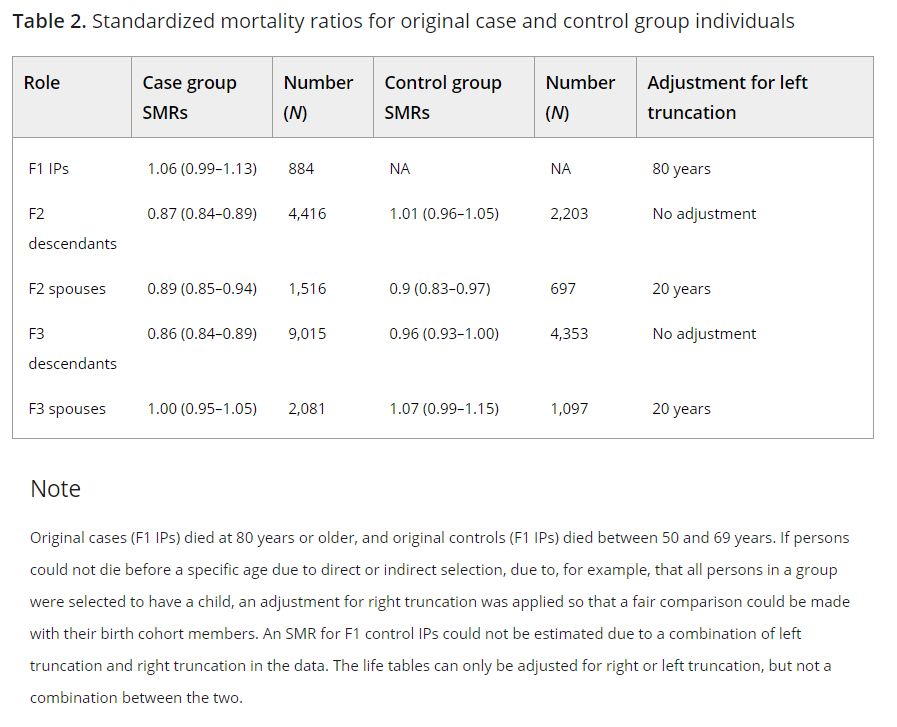
Focusing on the original approach (Figure 1a), we determined to what extent longevity is transmitted in the original case and the control group by estimating SMRs per generation for all cases and controls separately. Table 2 shows that F1 cases had a similar survival pattern to birth cohort members of the same sex, indicating that they resemble a representative group of random Dutch persons aged ≥80 years and born between 1860 and 1875. The SMR for the descendants of the cases (F2 case descendants) was 0.87 (95% CI = 0.84–0.89), indicating 13% less deaths than expected based on individuals from a similar birth cohort and sex. From here, we refer to this as 13% excess survival (or, if appropriate, excess mortality) compared with the general population. The descendants of controls (F2 control descendants) had a similar survival pattern to the general population (SMR = 1.01 [95% CI = 0.96–1.05]). The spouses of the F2 case and control descendants surprisingly also showed a pattern of excess survival (SMRcase_F2spouses = 0.89 [95% CI = 0.85–0.94] and SMRcontrol_F2spouses = 0.9 [95% CI = 0.83–0.97]). Next, we observed 14% (95% CI = 11%–16%) excess survival compared with the general population for F3 descendants of the F1 cases, whereas F3 control descendants resembled the general population (SMR = 0.96 [95% CI = 0.93–1.00]) just as observed in the F2 generation. The spouses of both F3 groups resembled the general population (SMRcase_F3spouses = 1.00 [95% CI = 0.95–1.05] and SMRcontrol_F3spouses = 1.07 [95% CI = 0.99–1.15]). We conclude that two descendant generations of cases, who belong on average to the top 10% survivors, have 13%–14% excess survival compared with the general populations and that the descendants of controls resemble the general population.
Table 2.
To explore to what extent the survival of F2 and F3 descendants depends on the extremity of the longevity of their parents, we calculated SMRs for F2 and F3 case and control descendants with increasing parental longevity (e.g., a parent belonged to the top 10%, 5%, or 1% survivors). We observed that the SMR decreased in descendants when defining parental longevity in terms of more extreme survival percentiles. This was the case for descendants of both the IP cases and controls although the effects were stronger in the descendants of the cases, especially in F3, since this group is now selected to have long‐lived parents and grandparents (Table S1). This illustrates that selection on single long‐lived persons belonging on average to the top 10% survivors, as we did for the IP selection, leads only to a modest transmission of longevity in two generations (max 14%). Likely, the control group includes misclassified persons of which the descendants do live longer, whereas the case group includes long‐lived persons that do not transmit longevity to their descendants (potentially these are phenocopies). Such misclassification can jeopardize genetic studies immensely. To be able to evaluate living persons as potential carriers of the heritable longevity trait in genetic studies, we constructed and validated a familial longevity score.
2.3 Constructing the Longevity Relatives Count score
We now look at the HSN data from a different perspective, the combined approach (Figure 1b). In the combined approach, we consider the F3 generation as the focal point of the pedigree, instead of the F1 generation, as was the case in the original approach. To identify individuals with the heritable longevity trait, we constructed the LRC score.
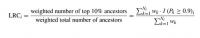
where i refers to the F3 descendants for whom the score is built. k is an index referring to each ancestral blood relative (from here: ancestors) of person i who are used to construct the score. Ni refers to the total number of ancestors of person i (Figure 1b), Pk is the sex and birth year‐specific survival percentile, based on life tables, of ancestor k, and I(Pk ≥ 0.9) indicates whether ancestor k belongs to the top 10% survivors.
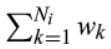
is the weighted total number of ancestors of F3 descendant i. The relationship coefficients are used as weights wk. The LRC score indicates the proportion of ancestors that has become long‐lived. For example, an LRC of 0.5 indicates 50% long‐lived ancestors (see methods for a more detailed and general description of the LRC score).
2.4 Longevity is transmitted when at least 20% of all ancestors are long‐lived
To determine what proportion of long‐lived ancestors could be associated with the survival of F3 descendants, we calculated LRC scores for all F3 descendants and subsequently defined nine mutually exclusive LRC groups (g) of F3 descendants: LRC_g1 = 0, LRC_g2 = [>0 & <0.1], LRC_g3 = [≥0.1 & <0.2], LRC_g4 = [≥0.2 & <0.3], LRC_g5 = [≥0.3 & <0.4], LRC_g6 = [≥0.4 & <0.5], LRC_g7 = [≥0.5 & <0.6], LRC_g8 = [≥0.6 & <0.7], and LRC_g9 = [≥0.7 & ≥1.0]. For each group of F3 descendants, we explored whether they have a survival benefit compared with the general population by estimating SMRs (Figure 2). F3 descendants without any long‐lived ancestors (LRC score of 0) had a survival pattern that resembled the general population (SMR = 0.97 [95% CI = 0.93–1.01]). Similarly, we observed a survival pattern that resembled the general population for F3 descendants with up to 20% long‐lived ancestors (groups 2 and 3, SMR = 0.97 [95% CI = 0.91–1.04] and SMR = 0.95 [95% CI = 0.91–1.00], respectively). This shows that the long‐lived ancestors of group 2 and group 3 F3 descendants were likely phenocopies instead of genetically enriched long‐lived persons. We observed a pattern of excess survival for F3 descendants with more than 20% long‐lived ancestors. The weakest significant effect was observed for group 3, with an SMR of 0.84 (95% CI = 0.80–0.89) which is comparable to the excess survival of the F3 descendants of the singleton F1 cases in the original approach (first part of the results). The strongest significant effect was observed for group 8, with an SMR of 0.56 (95% CI = 0.45–0.69). Hence, the higher the degree of long‐lived ancestors, the lower the SMR. This indicates that the more long‐lived ancestors an F3 descendant has, the higher the level of excess survival of these F3 descendants is compared to the general population, and the more likely that genetic effects drive the transmission of longevity.

Figure 2. LRC score in mutually exclusive F3 descendant groups. The figure shows standardized mortality ratios for all F3 descendants without missing age (at death or last observation) information. Please note that the group sizes are smaller than mentioned in the text as those in the text represent the full group sizes, including the persons with missing age information. The F3 descendants are grouped into mutually exclusive groups based on the LRC score. The LRC score represents the family approach as illustrated in Figure 1b. The dark red color of group 1 represents F3 descendants without any long‐lived (top 10%) ancestors and is denoted as family controls. The light red represents F3 descendants who had more than 0 and less than 20% long‐lived ancestors. The light blue colors represent the F3 descendants with 20% or more long‐lived ancestors. The dark blue color represents our cutoff point for the family case definition. Hence, all F3 descendants with 30% or more long‐lived ancestors were considered family cases. The beige color of group 9 shows that this bar represents all F3 ancestors with more than 70% long‐lived ancestors as their sample size was very low, we grouped them into one group.
Using the LRC score family method, we defined a new case and control group in the F3 generation, which is based on the presence or absence of longevity among the ancestors of the F3 generation and potential excess survival or mortality in the F3 generation itself (Figure 1b). The F3 family controls include all F3 descendants without any long‐lived ancestors (LRC score of 0, N = 4,166). To define the F3 family cases, we chose an LRC cutoff based on a tradeoff between the size and the uncertainty, given by the sample size, of the SMR. The F3 family cases include all F3 descendants with at least 30% long‐lived ancestors (LRC score ≥0.30 [N = 2,526]). Even if F3 family cases are not long‐lived themselves, their survival reflects the presence of longevity of their ancestors, which is transmitted by their parents. Similarly, F3 controls reflect the absence of longevity of their ancestors. Figure S1 shows the variation in lifespan of the F3 family case and control descendants. F3 descendants with more than 0% and up to 20% long‐lived ancestors (LRC score >0 and <0.2) did not express excess survival (N = 5,340). The F3 descendants with an LRC score ≥0.2 and <0.30 showed some excess survival compared with the general population, but the size of the SMR was considered too low to enter our family case definition. Hence, we denoted them as nonclassified (N = 2,639).
.../...
T O A C C E S S T H E R E S T O F T H E S T U D Y, P L E A S E V I S I T T H E S O U R C E .
.