.
O P E N A C C E S S S O U R C E : Genome Biology
Abstract
Background
Cellular senescence, a permanent state of replicative arrest in otherwise proliferating cells, is a hallmark of aging and has been linked to aging-related diseases. Many genes play a role in cellular senescence, yet a comprehensive understanding of its pathways is still lacking.
Results
We develop CellAge (
http://genomics.senescence.info/cells), a manually curated database of 279 human genes driving cellular senescence, and perform various integrative analyses. Genes inducing cellular senescence tend to be overexpressed with age in human tissues and are significantly overrepresented in anti-longevity and tumor-suppressor genes, while genes inhibiting cellular senescence overlap with pro-longevity and oncogenes. Furthermore, cellular senescence genes are strongly conserved in mammals but not in invertebrates. We also build cellular senescence protein-protein interaction and co-expression networks. Clusters in the networks are enriched for cell cycle and immunological processes. Network topological parameters also reveal novel potential cellular senescence regulators. Using siRNAs, we observe that all 26 candidates tested induce at least one marker of senescence with 13 genes (C9orf40, CDC25A, CDCA4, CKAP2, GTF3C4, HAUS4, IMMT, MCM7, MTHFD2, MYBL2, NEK2, NIPA2, and TCEB3) decreasing cell number, activating p16/p21, and undergoing morphological changes that resemble cellular senescence.
Conclusions
Overall, our work provides a benchmark resource for researchers to study cellular senescence, and our systems biology analyses reveal new insights and gene regulators of cellular senescence.
Background
In the 1960s, Leonard Hayflick and Paul Moorhead demonstrated that human fibroblasts reached a stable proliferative growth arrest between their fortieth and sixtieth divisions [1]. Such cells would enter an altered state of “replicative senescence,” subsisting in a non-proliferating, metabolically active phase with a distinct vacuolated morphology [2]. This intrinsic form of senescence is driven by gradual replicative telomere erosion, eventually exposing an uncapped free double-stranded chromosome end and triggering a permanent DNA damage response [3, 4]. Additionally, acute premature senescence can occur as an antagonistic consequence of genomic, epigenomic, or proteomic damage, driven by oncogenic factors, oxidative stress, or radiation [5]. Initially considered an evolutionary response to reduce mutation accrual and subsequent tumorigenesis, the pleiotropic nature of senescence has also been positively implicated in processes including embryogenesis [6, 7], wound healing [8], and immune clearance [9, 10]. By contrast, the gradual accumulation and chronic persistence of senescent cells with time promotes deleterious effects that are considered to accelerate deterioration and hyperplasia in aging [11]. Senescent cells secrete a cocktail of inflammatory and stromal regulators—denoted as the senescence-associated secretory phenotype, or SASP—which adversely impact neighboring cells, the surrounding extracellular matrix, and other structural components, resulting in chronic inflammation, the induction of senescence in healthy cells, and vulnerable tissue [12, 13]. Mice expressing transgenic INK-ATTAC, which induces apoptosis of p16-positive senescent cells, also have increased lifespan and improved healthspan [14]. It is, therefore, no surprise that in recent years gerontology has heavily focused on the prevention or removal of senescent cells as a means to slow or stop aging and related pathologies [15,16,17].
Research has sought to ascertain the genetic program and prodrome underlying the development and phenotype of senescent cells [18]. Expedited by recent advances in genomic and transcriptomic sequencing, alongside high-throughput genetic screens, a wealth of publicly available data now exists which has furthered the understanding of senescence regulation [19, 20]. Unfortunately, despite our increasing knowledge of cellular senescence (CS), determining whether a cell has senesced is not clear-cut. Common senescence markers used to identify CS in vitro and in vivo include senescence-associated β-galactosidase (SA-β-gal) and p16INK4A (p16) [21,22,23]. However, β-galactosidase activity has been detected in other cell types such as macrophages, osteoclasts, and cells undergoing autophagy [24,25,26]. Furthermore, some forms of senescence are not associated with p16 expression, while p16 has been detected in non-senescent cells [3, 27]. As such, there are now over 200 genes implicated in CS in humans alone. Therefore, it is necessary to conglomerate this data into a purposefully designed database.
Gene databases are highly useful for genomic computational analyses, as exemplified by the Human Ageing Genomic Resources (HAGR) [28]. HAGR provides databases related to the study of aging, including the GenAge database of aging-related genes, which contains genes related to longevity and aging in model organisms and humans, and DrugAge, which includes a compilation of drugs, compounds, and supplements that extend lifespan in model organisms. CellAge builds on these HAGR facilities to provide a means of studying CS in the context of aging or as a standalone resource; the expectation is that CellAge will now provide the basis for processing the discrete complexities of cellular senescence on a systematic scale.
Our recent understanding of biological networks has led to new fields, like network medicine [29]. Biological networks can be built using protein interaction and gene co-expression data. A previous paper used protein-protein interactions to build genetic networks identifying potential longevity genes along with links between genes and aging-related diseases [30]. Here, we present the network of proteins and genes co-expressed with the CellAge senescence genes. Assaying the networks, we find links between senescence and immune system functions and find genes highly connected to CellAge genes under the assumption that a guilt-by-association approach will reveal genes with similar functions [31].
In this study, we look at the broad context of CS genes—their association with aging and aging-related diseases, functional enrichment, evolutionary conservation, and topological parameters within biological networks—to further our understanding of the impact of CS in aging and diseases. Using our networks, we generate a list of potential novel CS regulators and experimentally validate 26 genes using siRNAs, identifying 13 new senescence inhibitors.
Results
The CellAge database
The CellAge website can be accessed at
http://genomics.senescence.info/cells/. Figure 1a presents the main CellAge data browser, which allows users to surf through the available data. The browser includes several columns with information that can be searched and filtered efficiently. Users can search for a comma-separated gene list or for individual genes. Once selected, a gene entry page with more detailed description of the experimental context will open.
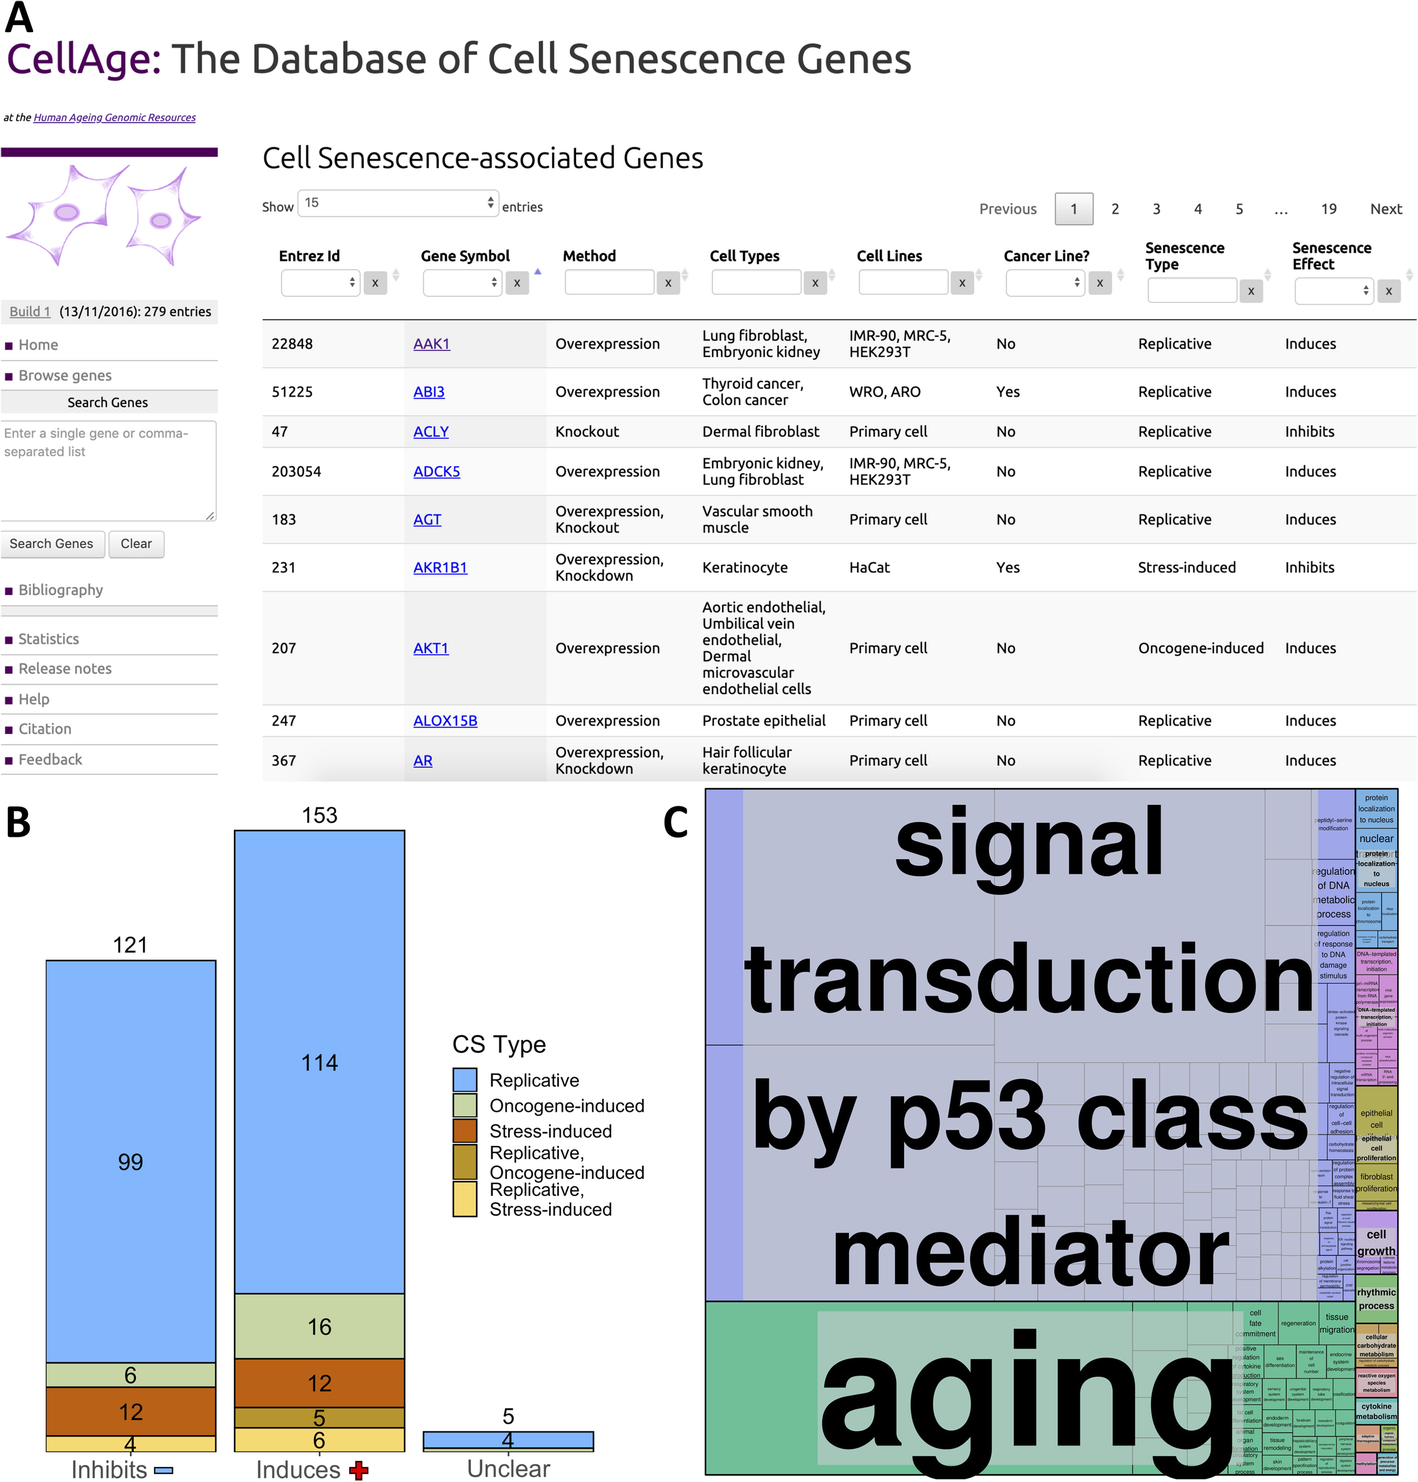
Fig. 1 - a The CellAge database of CS genes. The main data browser provides functionality to filter by multiple parameters like cell line and senescence type, and select genes to view details and links with other aging-related genes on the HAGR website. b Breakdown of the effects all 279 CellAge genes have on CS, and the types of CS the CellAge genes are involved in. Genes marked as “Unclear” both induce and inhibit CS depending on biological context. Numbers above bars denote the total number of genes inhibiting, inducing, or having unclear effects on CS. c Functional enrichment of the nonredundant biological processes involving the CellAge genes (p < 0.05, Fisher’s exact test with BH correction) (Additional file 1: Table S3). GO terms were clustered based on semantic similarities.
CellAge was compiled following a scientific literature search of gene manipulation experiments in primary, immortalized, or cancer human cell lines that caused cells to induce or inhibit CS. The first CellAge build comprises 279 distinct CS genes, of which 232 genes affect replicative CS, 34 genes affect stress-induced CS, and 28 genes affect oncogene-induced CS. Of the 279 total genes, 153 genes induce CS (~ 54.8%), 121 inhibit it (~ 43.4%), and five genes have unclear effects, both inducing and inhibiting CS depending on experimental conditions (~ 1.8%) (Fig. 1b). The genes in the dataset are also classified according to the experimental context used to determine these associations.
We have also performed a meta-analysis to derive a molecular signature of replicative CS and found 526 overexpressed and 734 underexpressed genes [32]. These gene signatures are also available on the CellAge website. Of the 279 CellAge genes, 44 genes were present in the signatures of CS (15.8%). This overlap was significant (p value = 1.62e−08, Fisher’s exact test). While 13 of the CellAge inducers of CS significantly overlapped with the overexpressed signatures of CS (8.5%, p = 2.06e−06, Fisher’s exact test), only 7 overlapped with the underexpressed signatures (4.6%, p = 5.13e−01, Fisher’s exact test). The CellAge inhibitors of CS significantly overlapped with both the overexpressed signatures of CS (n = 7, 5.8%, p = 4.08e−02, Fisher’s exact test) and underexpressed signatures of CS (n = 17, 14%, p = 2.06e−06, Fisher’s exact test).
CellAge gene functions
High-quality curated datasets enable systematic computational analyses [33, 34]. Since we are interested in learning more about the underlying processes and functionality shared by human CS genes, we started by exploring functional enrichment within the CellAge dataset.
Using the database for annotation, visualization and integrated discovery—DAVID Version 6.8 [35, 36], we found that genes in CellAge are enriched with several clusters associated with Protein Kinase Activity, Transcription Regulation, DNA-binding, DNA damage repair, and Cell cycle regulation in cancer. In particular, genes that induce senescence were more associated with promoting transcription, while genes that inhibit senescence were more associated with repressing transcription. Furthermore, we found that inducers of senescence were significantly associated with VEGF and TNF signalling pathways (p < 0.01, Fisher’s exact test with Benjamini-Hochberg correction) (Additional file 1: Table S1 and S2). WebGestalt 2019 was used to determine which nonredundant biological processes the CellAge genes are involved in, and REVIGO was used to cluster related processes (p < 0.05, Fisher’s exact test with BH correction) [37, 38]. A total of 298 categories were significantly enriched and clustered: Signal transduction by p53 class mediator; Aging; Protein localization to nucleus; DNA-templated transcription, initiation; Epithelial cell proliferation; Cell growth; Rhythmic process; Cellular carbohydrate metabolism; Reactive oxygen species metabolism; Cytokine metabolism; Adaptive thermogenesis; Organic hydroxy compound metabolism; Methylation; Generation of precursor metabolites and energy (Fig. 1c; Additional file 1: Table S3).
Evolutionary conservation of CellAge genes in model organisms
Next, we looked at the conservation of CellAge genes across a number of mammalian and non-mammalian model organisms with orthologues to human CellAge genes using Ensembl BioMart (Version 96) [39] in order to understand the genetic conservation of CS processes. There was a significantly higher number of human orthologues for CellAge genes than for other protein-coding genes in mouse, rat, and monkey, while non-mammalian species did not show significant conservation of CellAge genes (two-tailed z-test with BH correction) (Additional file 1: Table S4; Additional file 2: Fig. S1A). Interestingly, previous studies have found that longevity-associated genes (LAGs) are substantially overrepresented from bacteria to mammals and that the effect of LAG overexpression in different model organisms was mostly the same [40]. It remains unclear what the evolutionary origin of most of the CellAge genes is or why they are not present in more evolutionarily distant organisms. Unique evolutionary pressures could have played an important role in the evolution of CellAge genes in mammals. However, somatic cells in C. elegans and Drosophila are post mitotic and lack an equivalent CS process, which could explain why the CellAge genes are not conserved. We further compared the conservation of CellAge inducers and inhibitors of CS and found that while the inducers were significantly conserved in the mammal model organisms, the inhibitors were not (Additional file 2: Fig. S1B).
We also report the number of orthologous CellAge genes present in 24 mammal species using the OMA standalone software v. 2.3.1 algorithm [41] (Additional file 2: Fig. S1C). From 279 CellAge genes, we report 271 orthogroups (OGs) (Additional file 3). Twenty-two OGs were conserved in the 24 mammals, including the following genes: DEK, BRD7, NEK4, POT1, SGK1, TLR3, CHEK1, CIP2A, EWSR1, HDAC1, HMGB1, KDM4A, KDM5B, LATS1, MORC3, NR2E1, PTTG1, RAD21, NFE2L2, PDCD10, PIK3C2A, and SLC16A7 (Additional file 1: Table S5). Within the long-lived mammalian genomes analyzed (human, elephant, naked mole rat, bowhead whale, and little brown bat), we found 128 OG CellAge genes (Additional file 3; genomes available in Additional file 1: Table S6). However, finding OGs is dependent on genome quality and annotations, and higher-quality genomes would likely yield more OGs.
For the evolutionary distances, we found that the long-lived species had similar distances to the other species, meaning the branch lengths for long-lived species are distributed throughout the phylogeny as expected in a random distribution (Additional file 2: Fig. S1D). This was the case when we analyzed the concatenated tree for the 271 CellAge OGs as well as when we analyzed the 22 individual CellAge genes conserved among all 24 mammalian species (Additional file 4).
CellAge vs human orthologues of longevity-associated model organism genes
To understand how senescence is linked to the genetics of aging processes, we looked at the intersection of CellAge genes and the 869 genes in the human orthologues of model organisms’ longevity-associated genes (LAGs) dataset, collected based on quantitative changes in lifespan [34]. Like CellAge, where genes are classified based on whether their upregulation induces, inhibits, or has an unknown impact on CS, the longevity orthologues dataset also provides information on the effect of upregulation of its genes, namely whether it promotes (pro, 421) or inhibits (anti, 448) longevity (Additional file 1: Table S7; Additional file 2: Fig. S2).
The CS inducers statistically overlapped with the anti-longevity genes and not with the pro-longevity genes (anti: n = 9, ~ 6%, p = 1.42e−02; pro: n = 6, ~ 4%, p = 1.40e−01, Fisher’s exact test with BH correction). We noted an inverse result with the inhibitors of CS, where there was a much greater overlap between the CellAge inhibitors and the pro-longevity genes, resulting in the smallest p value of all the overlaps (n = 18, ~ 15%, p = 2.61e−10, Fisher’s exact test with BH correction). However, there was also a significant overrepresentation of genes inhibiting the CS process within the anti-longevity genes (n = 7, ~ 6%, p = 2.41e−02, Fisher’s exact test with BH correction). It is possible that some of the pathways the CS inhibitors are associated with increase longevity, whereas other pathways have anti-longevity effects. Overall, these results highlight a statistically significant association between CS and the aging process and suggest a potential inverse relationship between CS and longevity, at least for some pathways. Gene overlaps are available in Additional file 1: Table S8.
CellAge genes differentially expressed with age
In another work, we performed a meta-analysis to find molecular signatures of aging derived from humans, rats, and mice [42]. To investigate how the expression of CellAge genes changes with age, we looked for CellAge genes which either induce (153) or inhibit (121) senescence within the list of aging signatures. The genes overexpressed with age (449) had a significant overlap with the CellAge genes (CS inducers: n = 17, ~ 11%, p = 6.58e−07; CS inhibitors: n = 9, ~ 7%, p = 6.35e−03, two-tailed Fisher’s exact test with BH correction) while the genes underexpressed with age (162) did not (CS inducers: n = 0, p = 8.57e−01; CS inhibitors: n = 3, ~ 3%, p = 1.64e−01). The overexpressed genetic signatures of replicative CS (526) also significantly overlapped with the overexpressed signatures of aging (n = 60, ~ 11%, p = 1.18e−23), but not the underexpressed signatures of aging (n = 3, ~ 1%, p = 8.79e−01). Finally, the underexpressed signatures of replicative CS (734) did not significantly overlap with the overexpressed (n = 18, ~ 3%, p = 8.79e−01) or underexpressed (n = 9, ~ 1%, p = 3.26e−01) signatures of aging.
Given that 112 (40%) of CellAge genes have only been confirmed to control CS in fibroblasts, we repeated the above analyses using a subgroup of CellAge genes that have been shown to affect CS in other cell types. A total of 91 CellAge inducers of CS and 72 inhibitors were overlapped with the signatures of aging. The same overlaps were still significant after FDR correction, indicating that the differential expression of CellAge genes with age cannot exclusively be attributed to fibroblast idiosyncrasies (CS inducers overexpressed: n = 10, ~ 11%, p = 1.50e−04; underexpressed: n = 0, p = 1. CS inhibitors overexpressed: n = 6, ~ 8%, 1.34e−02; underexpressed: n = 2, ~ 3%, p = 1.98e−01).
Using all protein-coding genes from the meta-analysis as a background list [42], we further examined the CS inducers overexpressed with age for functional enrichment using WebGestalt 2019 to determine if specific biological processes were enriched [38]. In parallel, we performed this analysis using the genes which overlapped between CellAge inhibitors and genes overexpressed with age. In total, 71 GO terms were significantly enriched for the overlap between CellAge senescence inducers and age upregulated genes (p < 0.05 Fisher’s exact test with BH correction) (Additional file 1: Table S9). Because many of the enriched GO terms were redundant (e.g., wound healing and response to wound healing, regulation of cytokine production and cytokine production), they were clustered based on semantic similarity scores using REVIGO [37]. We found groups enriched for regulation of apoptotic processes, response to lipid, epithelium development, rhythmic process, circadian rhythm, cytokine metabolism, and cell-substrate adhesion (Additional file 2: Fig. S3A). A total of 71 enriched GO terms for the overexpressed signatures of CS overexpressed with age were clustered using REVIGO, resulting in enriched terms relating to regulated exocytosis, aging, response to beta-amyloid, and cell proliferation (Additional file 1: Table S10; Additional file 2: Fig. S3B). No GO terms were significantly enriched for the inducers of CS underexpressed with age, the inhibitors of CS differentially expressed with age, the underexpressed signatures of CS differentially expressed with age, or the overexpressed signatures of CS underexpressed with age.
Tissue-specific CS gene expression and differential expression of CS genes in human tissues with age
The Genotype-Tissue Expression (GTEx) project contains expression data from 53 different tissue sites collected from 714 donors ranging from 20 to 79 years of age, grouped into 26 tissue classes [43]. We asked if CellAge genes and differentially expressed signatures of CS were expressed in a tissue-specific manner [42] and determined how CS gene expression changes across different tissues with age [32].
We first examined tissue-specific CS expression and found that CellAge genes were either expressed in a tissue-specific manner less than expected by chance, or in line with expectations; in other words, the majority of CellAge genes tended to be expressed across multiple tissues (Additional file 1: Table S11; Additional file 2: Fig. S4A). Testis was the only tissue with significant differences between the actual and expected number of tissue-specific CellAge genes expressed (less tissue-specific genes than expected by chance, p < 0.05, Fisher’s exact test with BH correction). The underexpressed signatures of CS were significantly less tissue-specific in the testis and liver, while the overexpressed signatures of CS were significantly less tissue-specific in the brain, liver, pituitary, and skin, and more tissue-specific in blood. We also compared the ratio of tissue-specific to non-tissue-specific genes in the CS datasets to all protein-coding genes. While ~ 25% of all protein-coding genes are expressed in a tissue-specific manner, only ~ 10% of CellAge genes and ~ 11% of signatures of CS are expressed in a tissue-specific manner (Additional file 2: Fig. S4B), significantly less than expected by chance (p = 2.52e−12 and 3.93e−48 respectively, Fisher’s exact test with BH correction).
Then, we examined the differential expression of CS genes with age in different tissues. Using a previously generated gene set of differentially expressed genes (DEGs) with age in 26 tissues on GTEx [32, 43], we found overlaps with 268 CellAge inducers and inhibitors of CS present in the gene expression data (Fig. 2a). The process of finding DEGs with age filters out lowly expressed genes, which explains the 11 missing CellAge CS regulators. Overall, senescence inducers were overexpressed across different tissues with age, although none of the overlaps were significant after FDR correction (Fisher’s exact test with BH correction, p < 0.05) (Additional file 1: Table S12). There was the opposite trend in the inhibitors of CS, where there was noticeably less overexpression of CS inhibitors with age, although these overlaps were also not significant after FDR correction. A total of 1240 differentially expressed signatures of CS were also overlapped with the GTEx aging DEGs in 26 human tissues, including 9 tissues previously analyzed (Fig. 2b) [32]. The overexpressed signatures of CS were significantly overexpressed across multiple tissues with age, and only significantly underexpressed with age in the brain and uterus (p < 0.05, Fisher’s exact test with BH correction) (Additional file 1: Table S13). Furthermore, the underexpressed signatures of CS trended towards being overexpressed less than expected by chance across multiple tissues with age, although these overlaps were only significant after FDR adjustment in the colon and nerve, while the underexpressed signatures of CS were significantly overexpressed more than expected in the uterus. Finally, the underexpressed signatures of CS were underexpressed with age more than expected by chance in the colon, lung, and ovary, and underexpressed with age less than expected by chance in the brain. We also compared the ratio of differentially expressed to non-differentially expressed CS genes in at least one tissue with age to the equivalent ratio in all protein-coding genes (Additional file 2: Fig. S5A and S5B) (see Overlap Analysis in Methods). We found that ~ 64% of all protein-coding genes did not significantly change expression with age in any human tissues, while ~ 19% were overexpressed and ~ 17% were underexpressed (~ 7% were both overexpressed and underexpressed across multiple tissues) (Additional file 1: Table S14 and S15). For the CellAge genes, the number of inducers of CS significantly overexpressed with age in at least one tissue was significantly higher than the genome average (n = 50, ~ 30%, p = 1.5e−3, Fisher’s exact test with BH correction). The inducers of CS underexpressed with age and the inhibitors of CS differentially expressed with age were not significantly different from the protein-coding average. We also compared the number of signatures of CS differentially expressed with age in at least one tissue to the protein-coding genome average. The overexpressed signatures of CS were significantly differentially expressed with age compared to all protein-coding genes, whereas the number of underexpressed signatures of CS was underexpressed with age more than expected by chance.
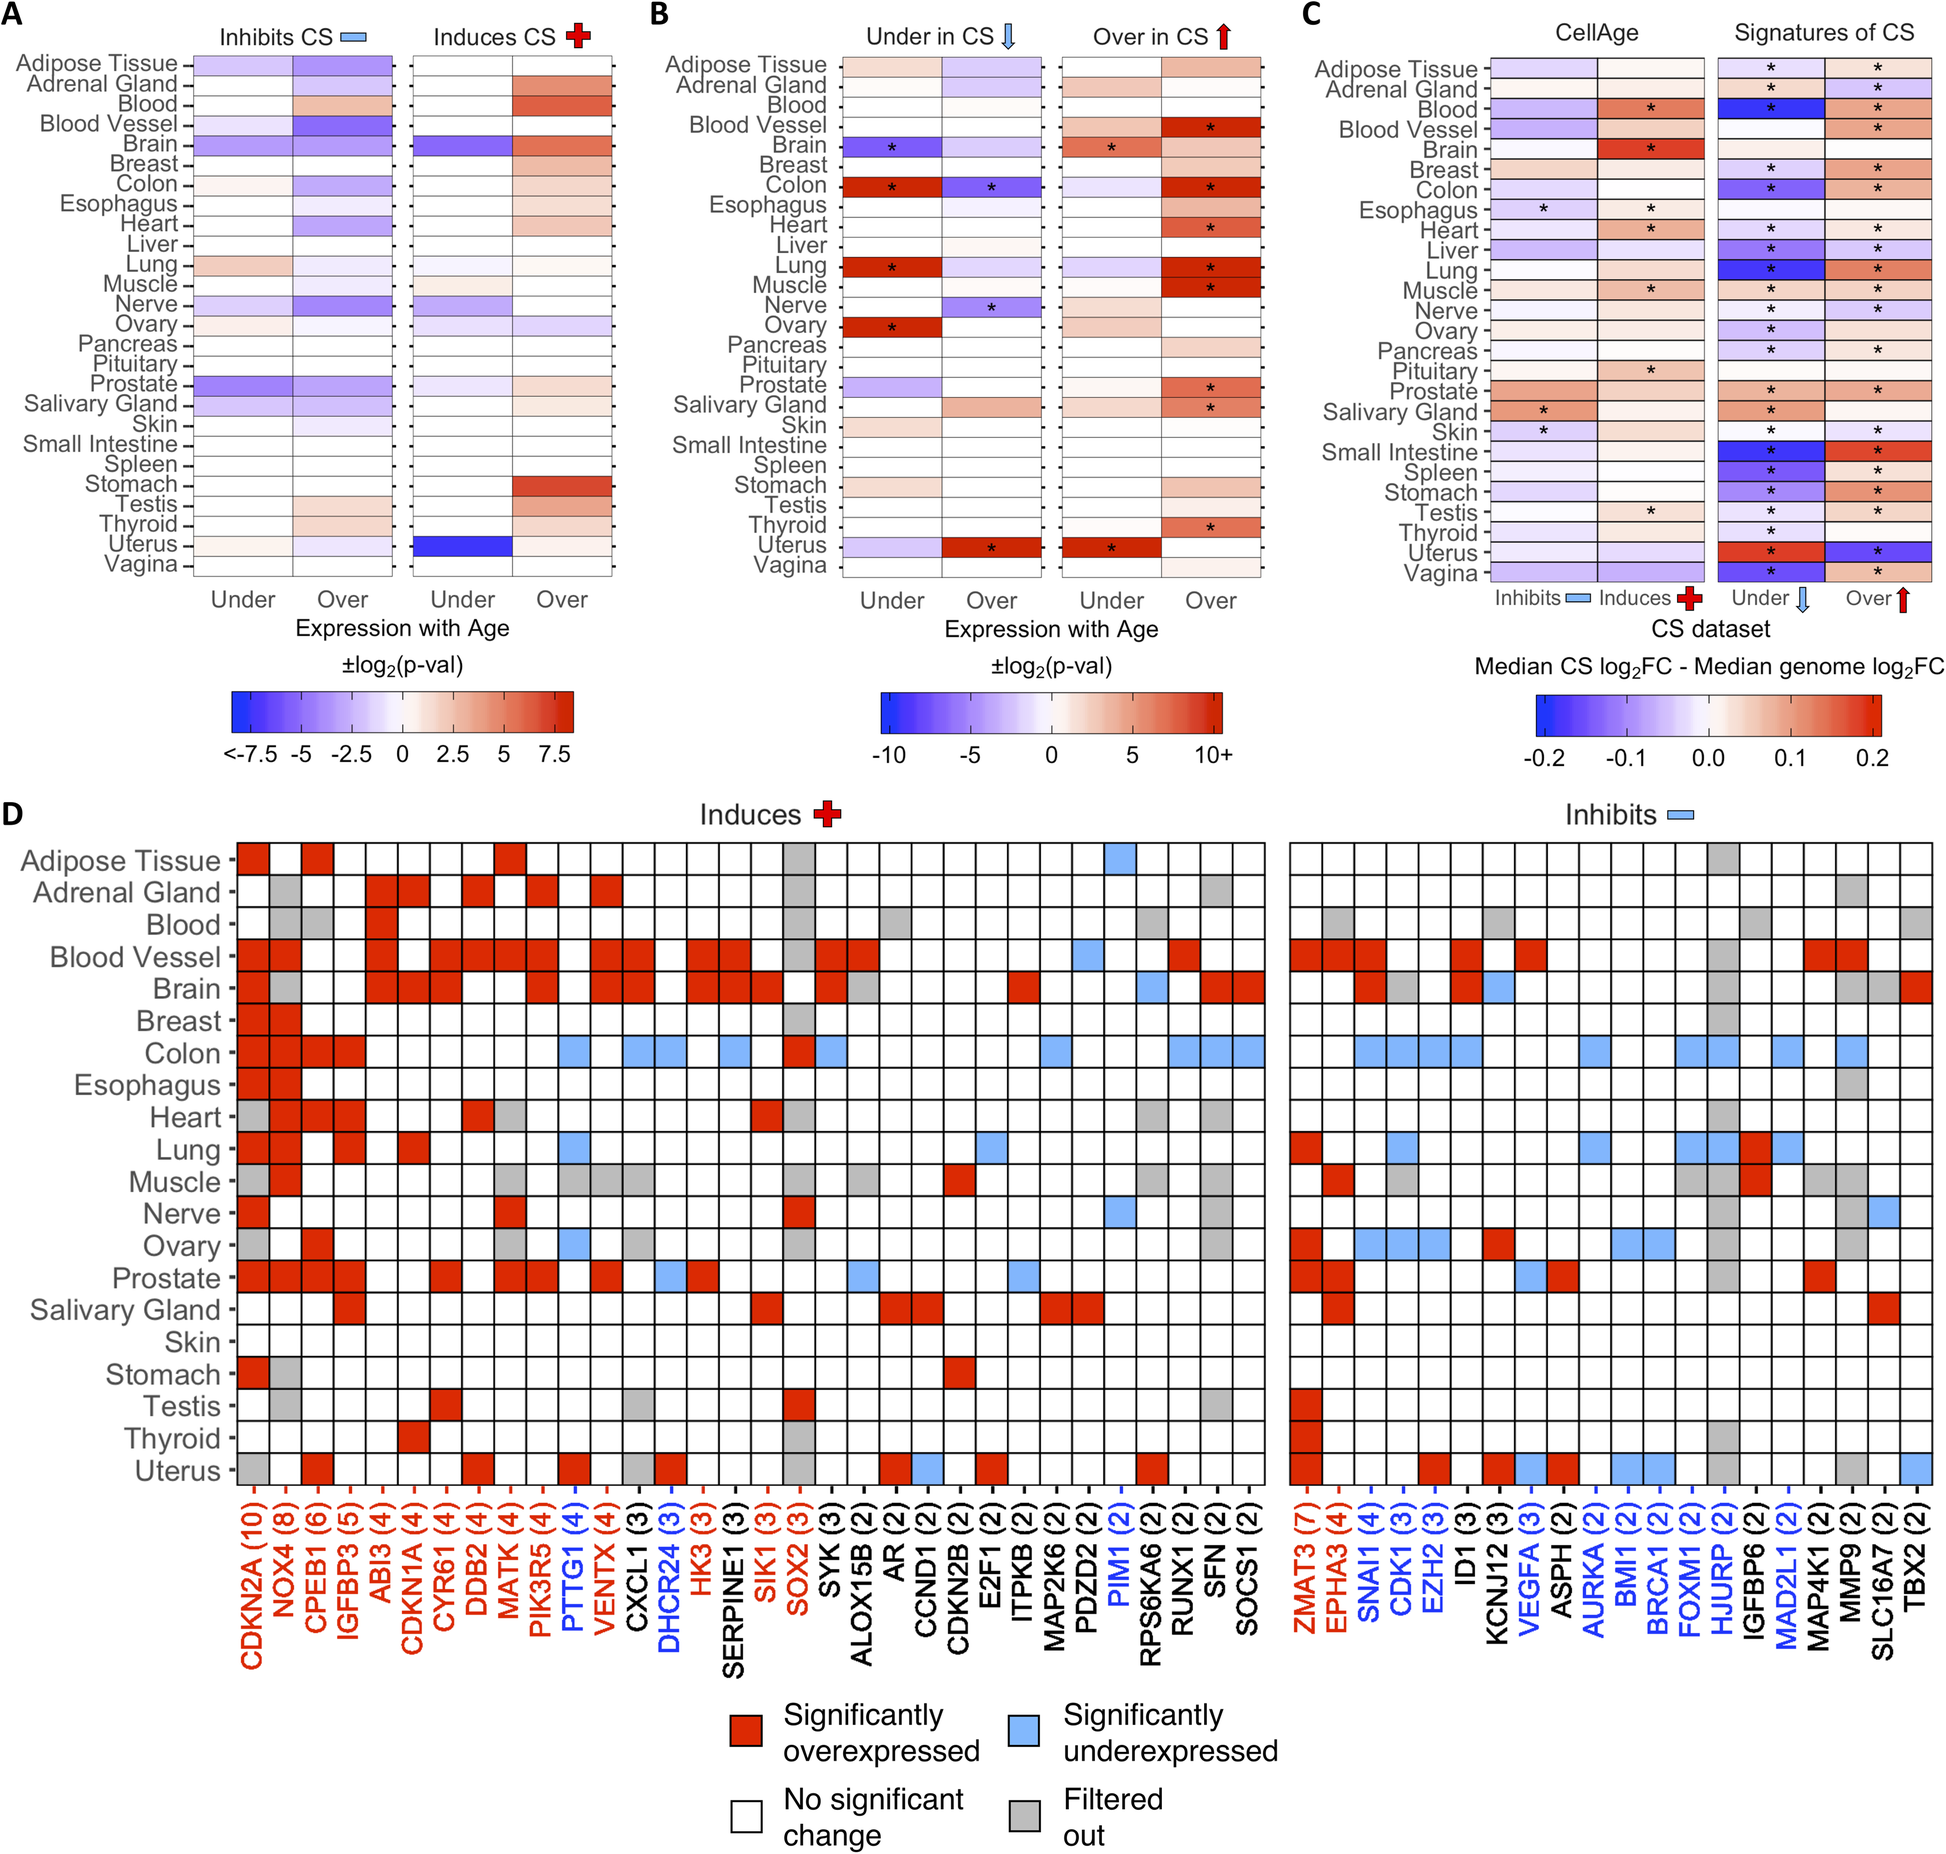
Fig. 2 - Differential expression of a CellAge inducers and inhibitors of CS and b differentially expressed signatures of CS in human tissues with age. Red values indicate that there were more genes differentially expressed with age than expected by chance (−log2(p-val)). Blue values indicate that there were less genes differentially expressed with age than expected by chance (log2(p-val)). Asterisks (*) denote tissues with significantly more CS genes differentially expressed with age (p < 0.05, Fisher’s exact test with BH correction, abs(50*log2FC) > log2(1.5)) (Additional file 1: Table S12 and S13). c Comparison of the median log2FC and distribution of log2FC with age between the CS genes and all protein-coding genes in human tissues. Red tiles indicate that the median log2FC of the CellAge and CS genes is higher than the median log2FC of all protein-coding genes for that tissue, while blue tiles indicate that the median log2FC of the CS genes is lower than the median genome log2FC. Asterisks (*) indicate significant differences between the log2FC distribution with age of CS genes and the log2FC distribution with age of all protein-coding genes for that tissue (p < 0.05, Wilcoxon rank sum test with BH correction) (Additional file 1: Table S16). d CellAge genes differentially expressed in at least two tissues with age. Gray tiles are genes which had low basal expression levels in the given tissue and were filtered out before the differential gene expression analysis was carried out [32]. Colored tiles indicate significant differential expression with age (p < 0.05, moderated t-test with BH correction, abs(50*log2FC) > log2(1.5)). Numbers by gene names in brackets denote the number of tissues differentially expressing the CellAge gene with age. Red gene names specify that the CellAge gene was significantly overexpressed with age in more tissues than expected by chance, while blue gene names show the CellAge genes significantly underexpressed with age in more tissues than expected by chance (p < 0.05, random gene expression tissue overlap simulations) (Additional file 1: Table S17 – S20). Liver, pancreas, pituitary, spleen, small intestine, and vagina did not have any significant CS DEGs with age.
The overall fold change (FC) with age of the CS genes was also compared to the FC with age of all protein-coding genes for each tissue in GTEx (Fig. 2c; Additional file 1: Table S16). The median log2FC with age of the CellAge CS inducers and the overexpressed signatures of CS was greater than the genome median for the majority of tissues on GTEx, although the difference in log2FC distribution with age between the inducers of CS and all protein-coding genes was only significant in seven tissues (Wilcoxon rank sum test with BH correction, p < 0.05). The median log2FC with age of the CellAge inhibitors of CS and the underexpressed signatures of aging was smaller than the genome median in the majority of tissues, showcasing the opposite trend to the inducers of CS and overexpressed signatures of CS. However, the only tissues with significantly different distributions of log2FC with age for the inhibitors of CS were the skin and esophagus, where the median log2FC distribution was significantly less than the genome average, and the salivary gland, where the median log2FC distribution was significantly more than the genome average. We also found that the distribution of log2FC with age of the differentially expressed signatures of CS significantly changed in opposite directions with age in 14 tissues. Interestingly, this trend was present even in the adrenal gland and uterus, where the signatures of CS changed with age in the opposite direction to the majority of other tissues.
.../...
.
Edited by Engadin, 07 April 2020 - 10:18 PM.